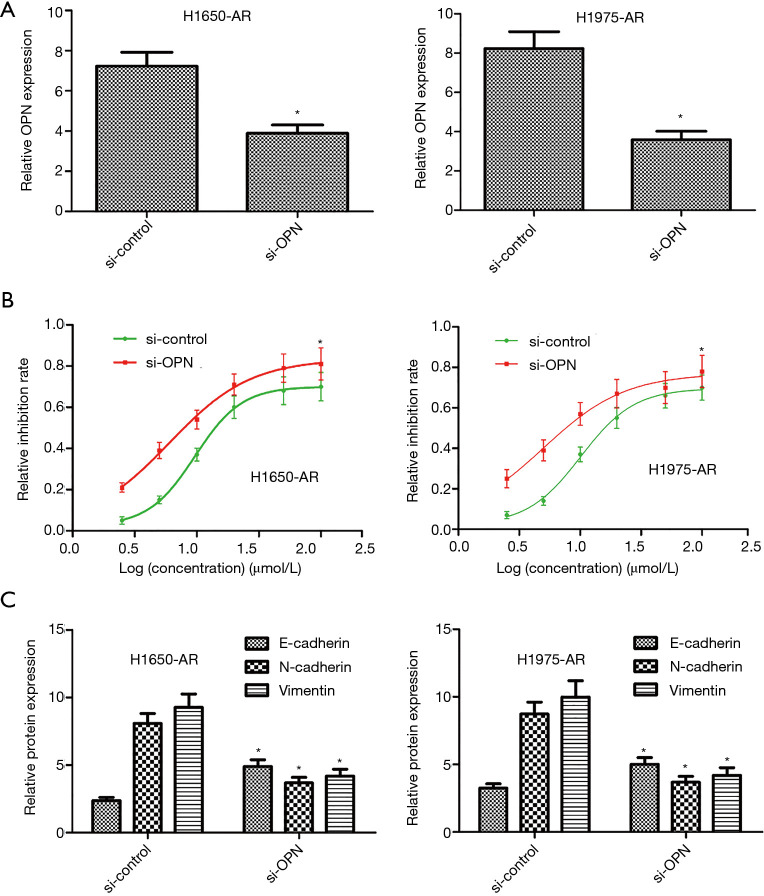
Figure 5.
Inhibition of OPN overcomes acquired resistance to afatinib in H1650-AR and H1975-AR cells. (A) Following transfection of OPN-specific siRNAs into H1650-AR and H1975-AR cells, the expression level of OPN protein was measured by western blot. (B) The inhibition rates of cells treated with afatinib were determined by cell proliferation inhibition assay. The IC50 values were calculated through Graph Pad Prism 5. (C) The expression levels of E-cadherin, N-cadherin, and Vimentin were measured by western blot. Quantitative analysis was performed by determining the ratio between indicated protein and GAPDH protein levels from three different experiments with densitometry. Each experiment was repeated at least 3 times independently. Asterisks indicated statistically significant differences. Data was represented as means ± SD. *P<0.01, vs. control. OPN, osteopontin.

