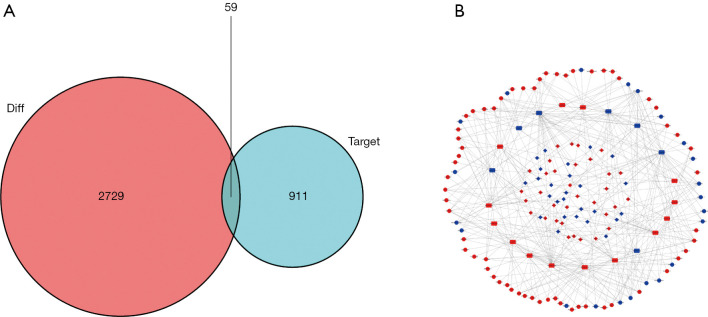
Figure 2.
Establishment of the ceRNA network. (A) Venn diagram of the aberrantly expressed mRNAs related to ceRNA regulatory network. The red area indicates the total number of DEmRNA, while the blue area represents the target number. The intermediate purple area indicates the total number of the differentially expressed and targeted mRNAs. (B) The ceRNA network of GC patients. The red and blue nodes indicate upregulated and downregulated expression, respectively. lncRNA, miRNA and mRNA are shown as circles, rectangles, and diamonds, respectively. ceRNA, competing endogenous RNA; DEmRNA, differentially expressed mRNA; GC, gastric cancer.

