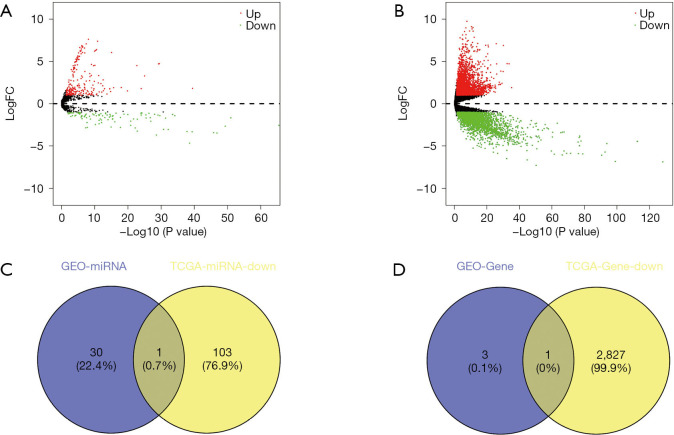
Figure 5.
Differentially expressed miRNAs and mRNAs in gastric cancer. (A) Differential expression of miRNAs from TCGA; (B) Differential expression genes from TCGA; |logFoldChange| >1 and P value <0.05 were set as criteria; (C) Venn diagram for the miRNA’s intersections; (D) Venn diagram for the mRNA’s intersections. Because there were no overlapped terms between the group of up-regulated miRNAs or genes from TCGA and the predicted miRNAs or genes at the downstream of hsa_circ_0067934, the Venn diagram is not shown.

