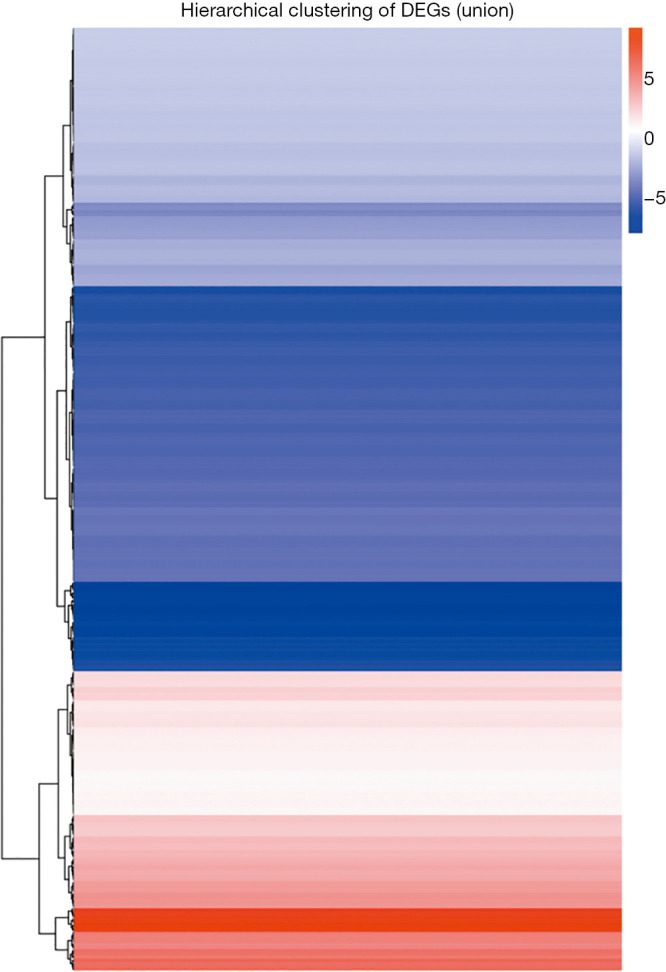
Figure 3.

Hierarchical cluster analysis of differential miRNAs expression between the IH and CTL groups. X axis represents each comparing samples. Y axis represents differentially expressed miRNAs. Coloring indicates fold change: up-regulated: red, down-regulated: blue. CTL, normoxia, control; IH: intermittent hypoxia.
