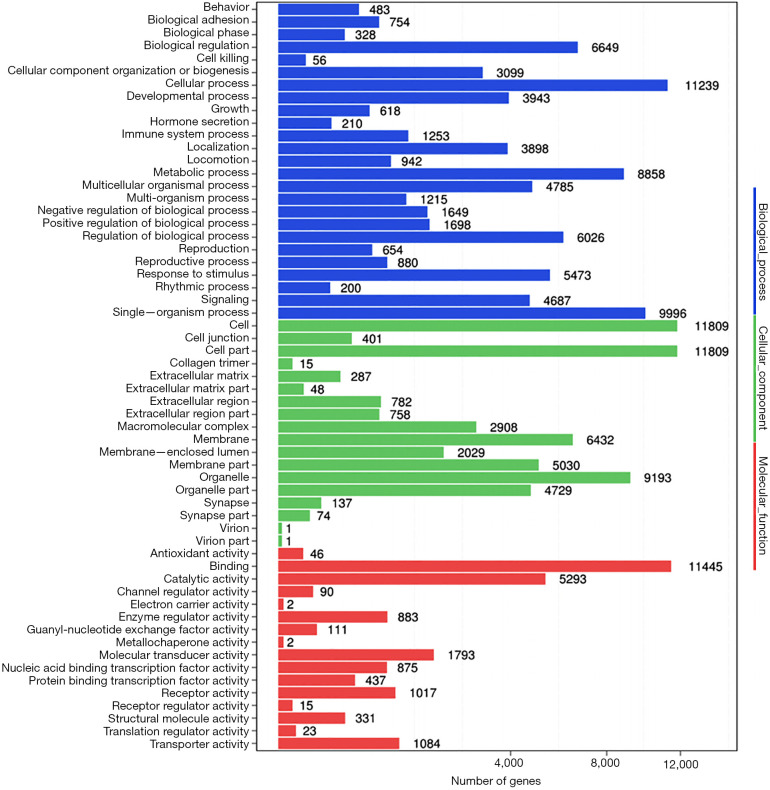
Figure 5.
Gene ontology enrichment analysis of the discrepant miRNAs. X axis represents number of differentially expressed miRNAs (the number is presented by its square root value). Y axis means GO terms. All GO terms are divided into three ontologies: biological process (blue), cellular component (green) and molecular function (red). The number of genes shows at the top of each bar. GO, gene ontology.

