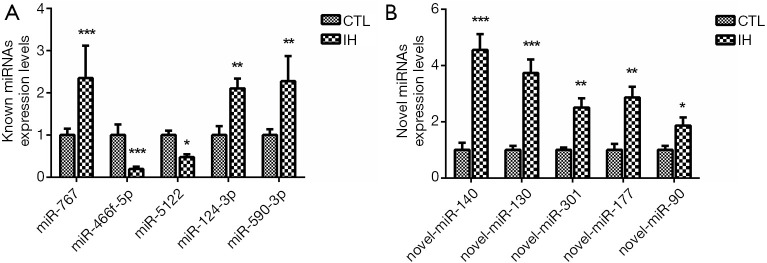
Figure 7.
RT-PCR results of the top 10 differentially expressed miRNAs. The RT-PCR results showed that the differences trend in top 5 known miRNAs (A) and top 5 novel miRNAs (B) were consistent with the NGS results. ***: P<0.001, when compared with CTL group; **: P<0.01, when compared with CTL group; *: P<0.05, when compared with CTL group. RT-PCR, real-time polymerase chain reaction; CTL, normoxia, control; IH, intermittent hypoxia.

