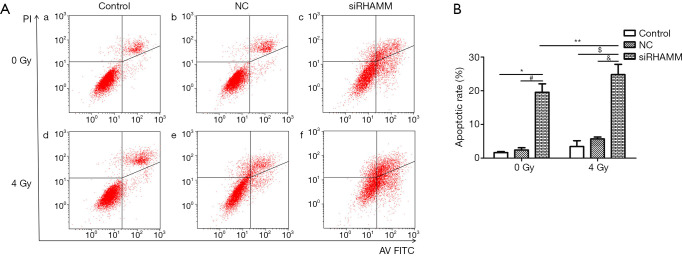
Figure 5.
Apoptosis of the A549 cell line. (A) Dot plot scattergrams for the: (a) Control group, (b) NC group, (c) siRHAMM group, (d) Control + R group, (e) NC + R group, and (f) siRHAMM + R group; (B) histogram showing the higher apoptotic rate in the siRHAMM group (19.57%±2.51%) compared with the Control and NC groups (1.67%±0.30% and 2.42%±0.66%, respectively). *, P<0.05 vs. Control group; #, P<0.05 vs. NC group. The apoptotic rate was higher in the siRHAMM + R group (24.81%±3.05%) than in the siRHAMM, Control + R (3.45%±1.73%), and NC + R (5.71%±0.58%) groups. **, P<0.05 vs. siRHAMM group; $, P<0.05 vs. Control + R group; &, P<0.05 vs. NC + R group. RHAMM, receptor for hyaluronan-mediated motility; Control, mock transfection; NC, negative control; siRHAMM, RHAMM knockdown; R, radiation.

