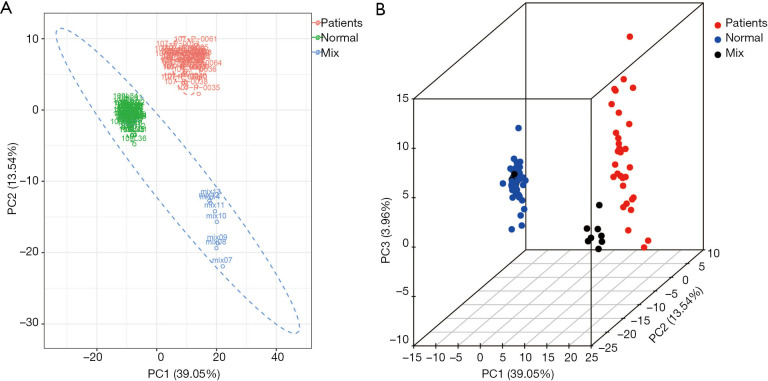
Figure 1.
Principal component analysis showed high discrimination accuracy between NSCLC patients, healthy controls and the group mix. Group mix is used as the quality control sample (A) 2D plot, NSCLC patients: Red, healthy controls: green, mix group: blue; (B) 3D plot, NSCLC patients: red, healthy controls: blue, mix group: black. NSCLC, non-small cell lung cancer.

