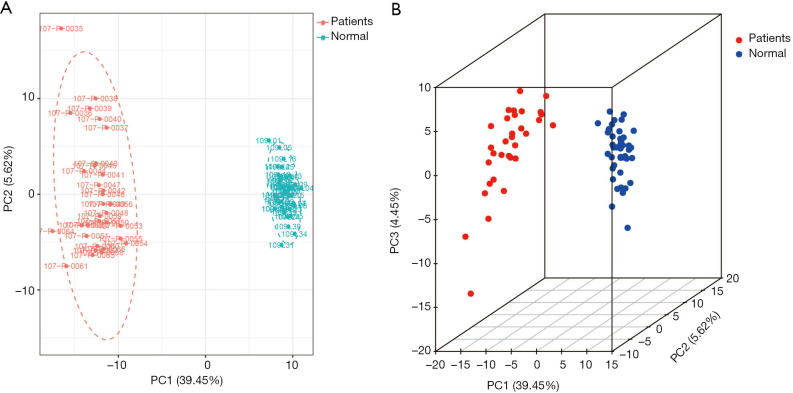
Figure 2.
The intragroup two principal components analysis showed that although individuals within the lung cancer NSCLC group (red) had larger differences compared to individuals within the normal healthy control group (blue), no obvious clustering pattern can be observed. (A) 2D plot and (B) 3D plot. NSCLC, non-small cell lung cancer.

