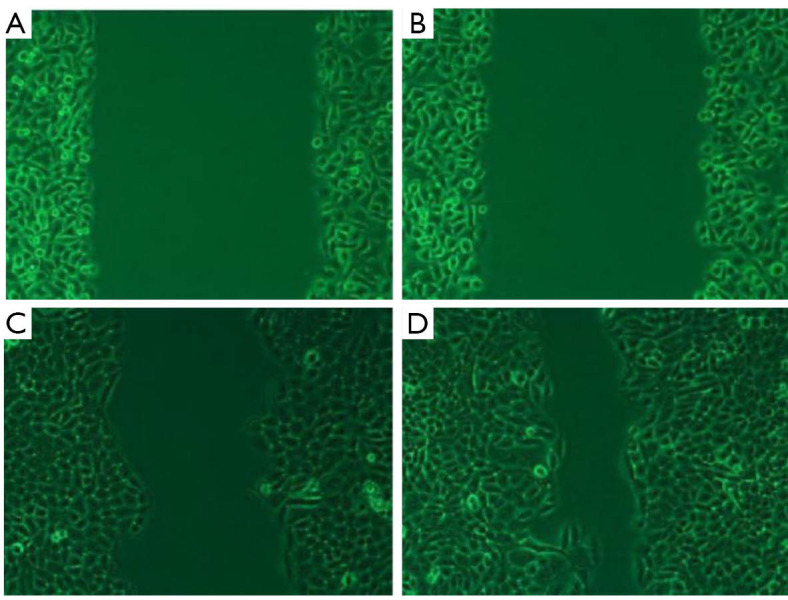
Figure 4.

Migration of TSCCA cells. (A,B,C,D) Experimental group at 0 h, control at 0 h, experimental group at 48 h, control at 48 h. (microscope magnifying ×10).

Migration of TSCCA cells. (A,B,C,D) Experimental group at 0 h, control at 0 h, experimental group at 48 h, control at 48 h. (microscope magnifying ×10).