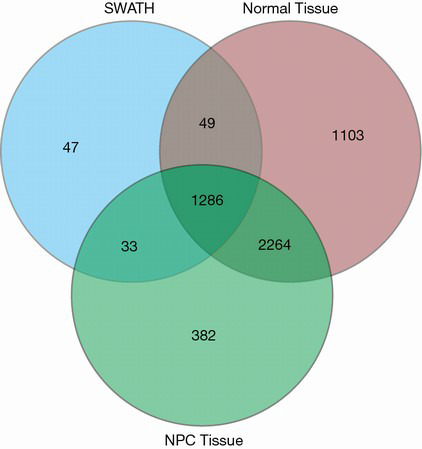
Figure 2.

Comparison of the results of LC-MS/MS and SWATH-MS. Blue color represents the proteins detected by SWATH-MS; the red and green represent proteins detected by LC-MS/MS in normal nasopharyngeal tissue and NPC, respectively. LC-MS/MS, liquid chromatography coupled to tandem mass spectrometry; SWATH-MS, sequential windowed acquisition of all theoretical fragment ions mass spectrometry; NPC, nasopharyngeal carcinoma.
