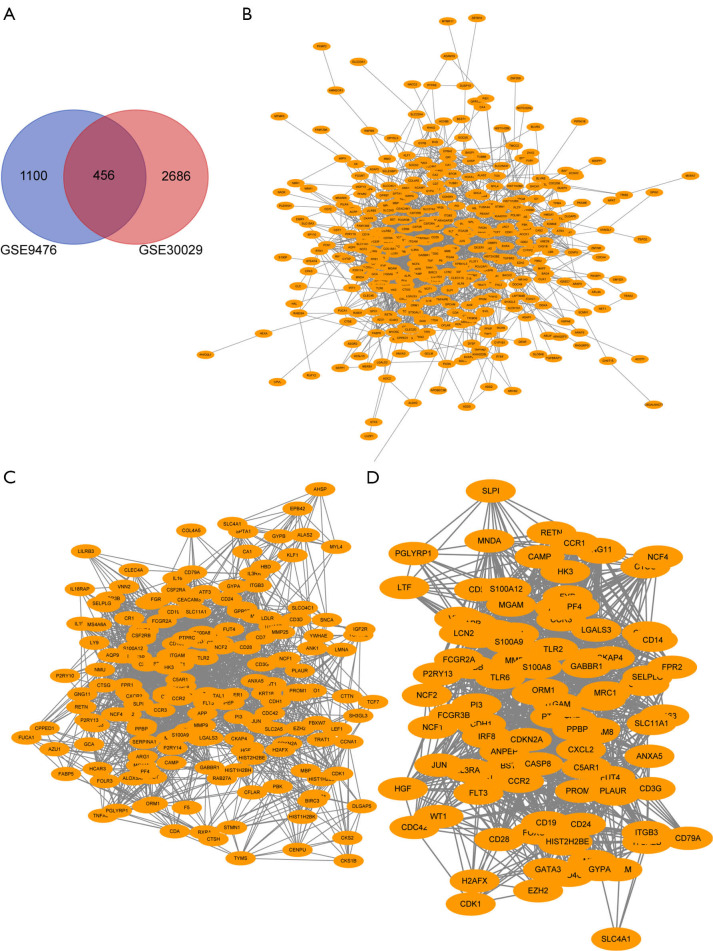
Figure 1.
Venn diagram, PPI network of DEGs. (A) Venn diagram of the DEGs common to the two GEO datasets; (B) PPI network constructed with the 456 DEGs by the STRING; (C) 183 genes met the condition of degree ≥10, and visualization through the STRING and Cytoscape; (D)100 genes were visualized by the STRING and Cytoscape. PPI, protein-protein interaction; DEGs, differentially expressed genes; GEO, Gene Expression Omnibus. GDSC, Genomics of Drug Sensitivity in Cancer.

