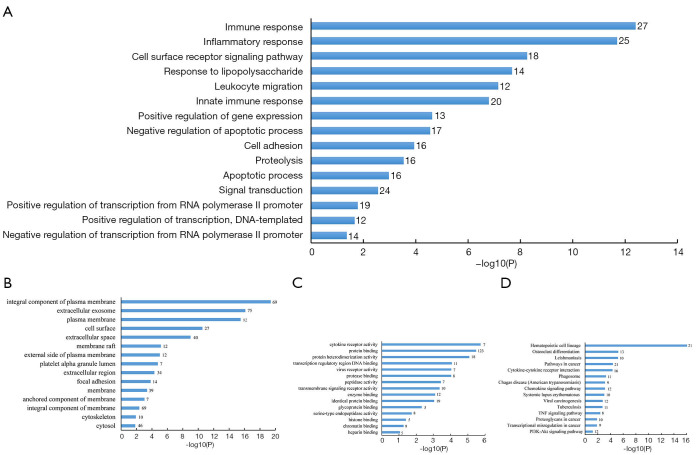
Figure 2.
The GO analysis and KEGG pathway analysis for the 183 DEGs. The blue bars were the enrichment terms, and the length of the bars was represented by the P value. At the same time, at the far right of each bar was the count of genes enriched in this particular process/pathway. (A) Top 15 GO terms in biological processes; (B) top 15 GO terms in cell component; (C) top 15 GO terms in molecular function; (D) top 15 enriched pathway of the 183 DEGs. GO, Gene Ontology; KEGG, Kyoto Encyclopedia of Genes and Genomes; DEGs, differentially expressed genes.

