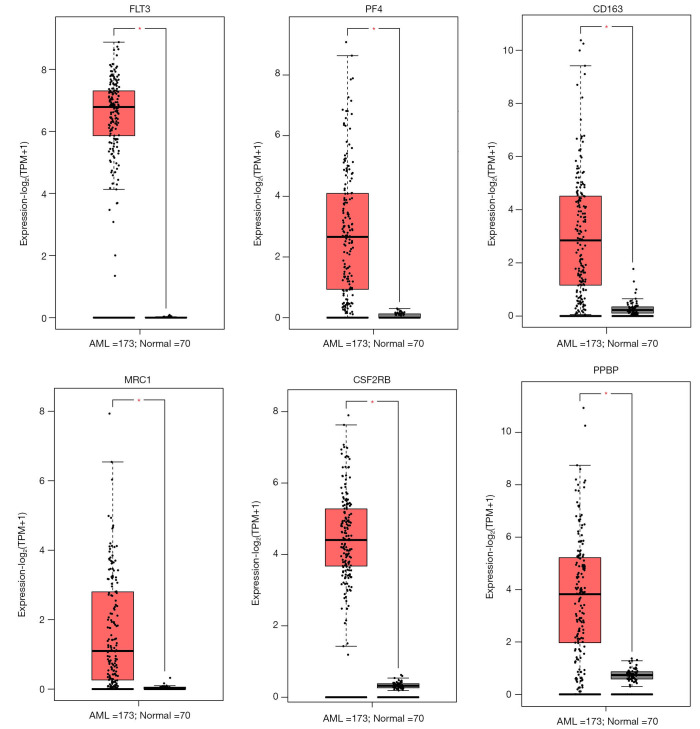
Figure 3.
The expression levels of the six candidate genes in AML. The results are based on TCGA and GTEx data screening in AML (n=173) and normal control (n=70) from GEPIA2 database through the Expression DIY (box plot) (*, P<0.05), the red boxes are represented as the AML sample and the black boxes are represented as the normal tissue. FLT3, FMS-related tyrosine kinase 3; PF4, platelet factor 4; CD163, the macrophage scavenger receptor; MRC1, mannose receptor C-type 1; CSF2RB, colony stimulating factor 2 receptor subunit beta; PPBP, pro-platelet basic protein; AML, acute myeloid leukemia; TCGA, The Cancer Genome Atlas.

