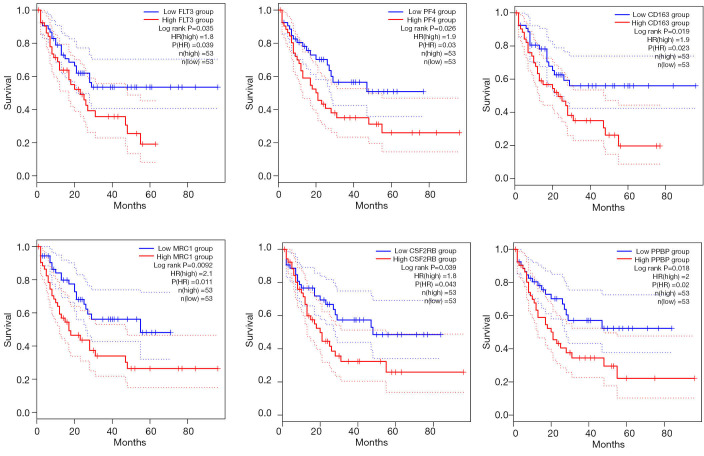
Figure 4.
Kaplan-Meier survival curves of overall survival for the six candidate genes in AML. The survival curves are plotted using the GEPIA2 web server. Survival curves are represented as dotted lines, and the solid line represents the 95% confidence interval. The number of AML and normal bone marrow tissues (n) =53. The P values are calculated using log-rank statistics. FLT3, FMS-related tyrosine kinase 3; PF4, platelet factor 4; CD163, the macrophage scavenger receptor; MRC1, mannose receptor C-type 1; CSF2RB, colony stimulating factor 2 receptor subunit beta; PPBP, pro-platelet basic protein; AML, acute myeloid leukemia; HR, hazard ratio.

