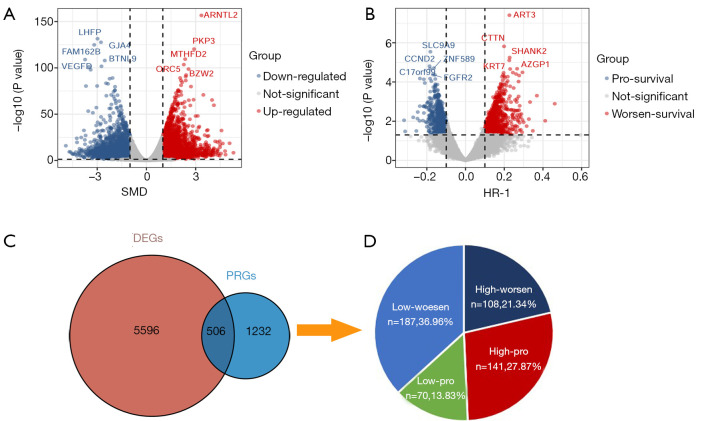
Figure 1.
Distribution of differentially expressed genes (DEGs) and prognostically relevant genes (PRGs) in lung squamous cell carcinoma. (A) Volcano plots of DEGs in GEO and TCGA samples provided by Lung Cancer Explorer (LCE). The x-axis represents the standard mean difference (SMD), and the y-axis represents the P value. The red and blue dots represent upregulated (SMD >1) and downregulated (SMD <−1) genes. (B) Volcano plots of PRGs in GEO and TCGA samples provided by LCE. The x-axis represents the hazard ratio minus 1 (HR-1), and the y-axis represents the P value. The red and blue dots represent pro-survival (HR >1.1) and worse-survival (HR <0.9) genes. (C) Venn diagram demonstrating the intersections of genes between DEGs and PRGs. (D) Pie chart showing the percentage of the 4 gene sets.

