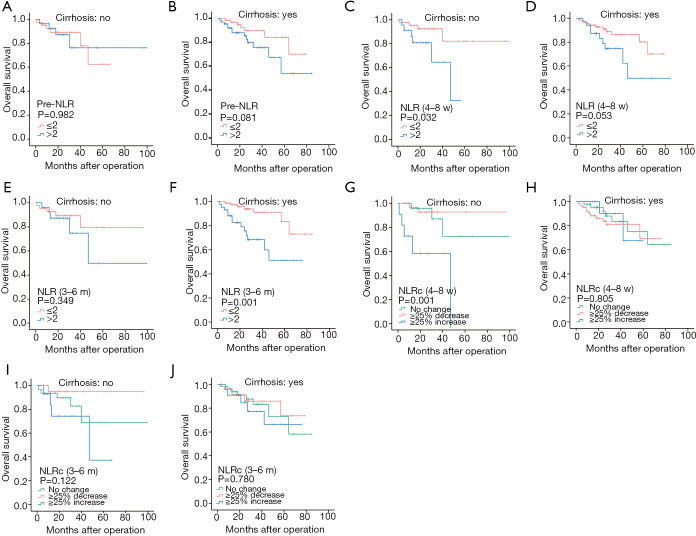
Figure 6.
Kaplan-Meier curves for overall survival of NLRs and NLRcs in HCC patients with and without cirrhosis. Without cirrhosis: pre-NLR (A), NLR (4–8 w) (C), NLR (3–6 m) (E), NLRc (4–8 w) (G) and NLRc (3–6 m) (I); with cirrhosis: pre-NLR (B), NLR (4–8 w) (D), NLR (3–6 m) (F), NLRc (4–8 w) (H) and NLRc (3–6 m) (J).

