Figure 1.
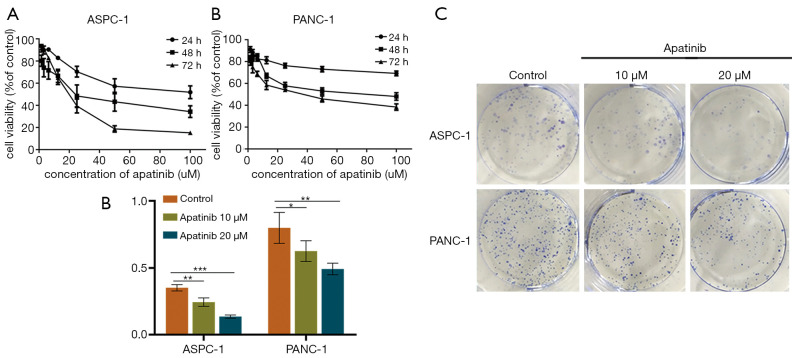
Apatinib inhibited cell viability and proliferation in a dose- and time-dependent manner. SRB assay showing growth curves of ASPC-1 cells (A) and PANC-1 cells (B) treated with different doses (0, 20, 40, 60, 80, 100 µM) of apatinib for different periods of time (24, 48, 72 h). Representative images (C) and summarized data (D) of a colony formation assay exhibiting the proliferation of ASPC-1 and PANC-1 cells. Data are presented as mean ± SD (n=5). *, P<0.05; **, P<0.01; ***, P<0.001 (n=3) vs. control group. SRB, sulforhodamine B.

