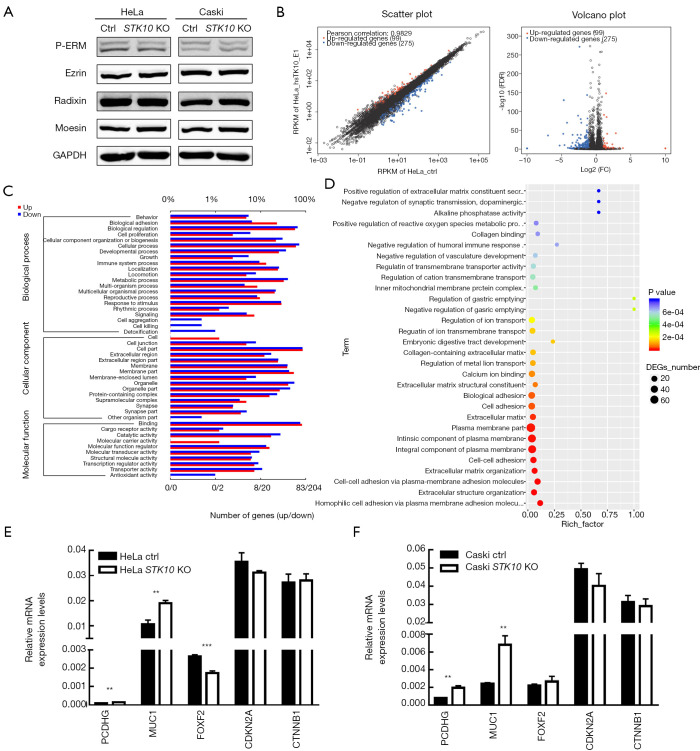
Figure 6.
Cervical cancer cells lacking STK10 extensive display alterations in gene expression. (A) Western blot analysis of STK10-related downstream proteins. (B) Scatter plot (left panel) and a volcano plot (right panel) show differential expressed genes (DEGs) between HeLa control and HeLa STK10 knockout groups. (C) The pattern of GO categories of the DEGs in the HeLa STK10 knockout group. Distribution of the GO categories were classified as a biological process, cellular component, or molecular function. (D) GO enriched analysis of the bubble diagram. The more significant the rich factor, the higher the degree of enrichment. P value closer to zero, the more significant the enrichment. (E,F) Expression change profiles of five genes in HeLa (E) and Caski (F) by quantitative real-time polymerase chain reaction (qRT-PCR). Data represent the mean ± standard deviation (SD), n=3 in each group. **, P<0.01; ***, P<0.001.

