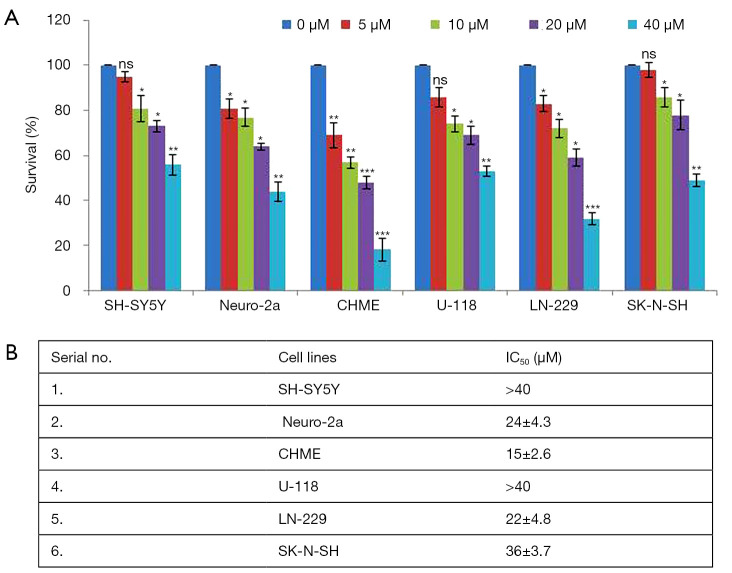
Figure 1.
Rutin-induced cytotoxicity in different cell lines. (A) The viability of different cell lines was inhibited by rutin in a concentration-dependent manner over 24 h; (B) the IC50 values of the cancer cell lines SH-SY5Y, Neuro-2a, CHME, U-118, LN-229, and SK-N-SH were calculated as >40, 24±4.3, 15±2.6, >40, 22±4.8, and 36±3.7 µM, respectively. The results presented here are the means of three individual experiments. A statistical analysis was carried out using ANOVAs or t-tests followed by the Bonferroni correction. Statistical significance was considered at levels of *P<0.05, **P<0.01, and ***P<0.001 compared with the untreated control. IC50, half maximal inhibitory concentration; ANOVAs, analysis of variances.

