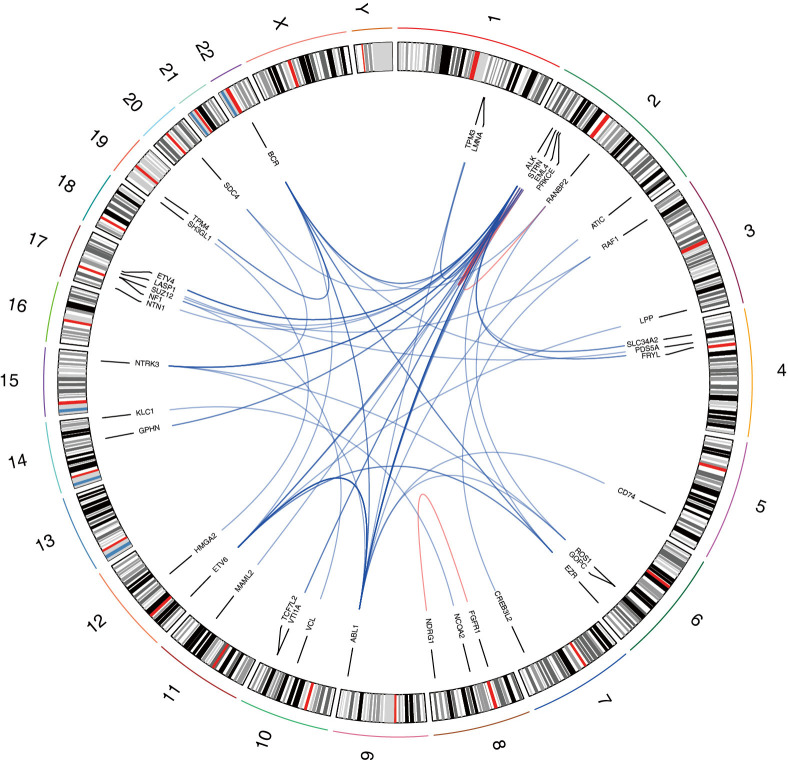
Figure 3.
A circos plot of potential oncogenic gene fusion events. A total of 49 unique potential oncogenic gene fusion events were mapped in and shown on this circos plot. The red lines represented intrachromosomal gene fusions and the blue lines represented interchromosomal gene fusions. The shade of the color reflects the frequency of gene fusions. For example, the color of the link between ETV6 and ABL1 was deeper than other links because ETV6-ABL1 fusion was detected in 7 prostate cancer samples.

