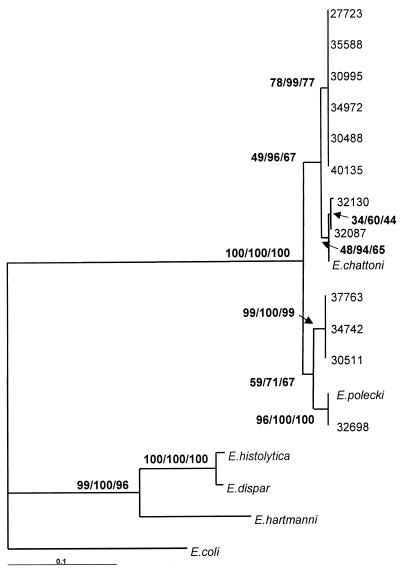
FIG. 2.
Phylogenetic analysis of partial ribosomal DNA sequences. The alignment in Fig. 1 with the added sequences was edited by hand, and phylogenetic analyses were performed using PAUP* 4.0. Maximum likelihood analysis used the HKY model of nucleotide substitution and a transition/transversion ratio of 2, and 100 bootstrap replicates were performed. For both minimum evolution and maximum parsimony analyses, a fast heuristic search was performed with random stepwise addition and 500 bootstrap replicates. Bootstrap support for each analysis is shown at each individual node in the order maximum likelihood, minimum evolution, and maximum parsimony. The scale bar represents the tree distance for the 0.1 changes per site in the sequence.

