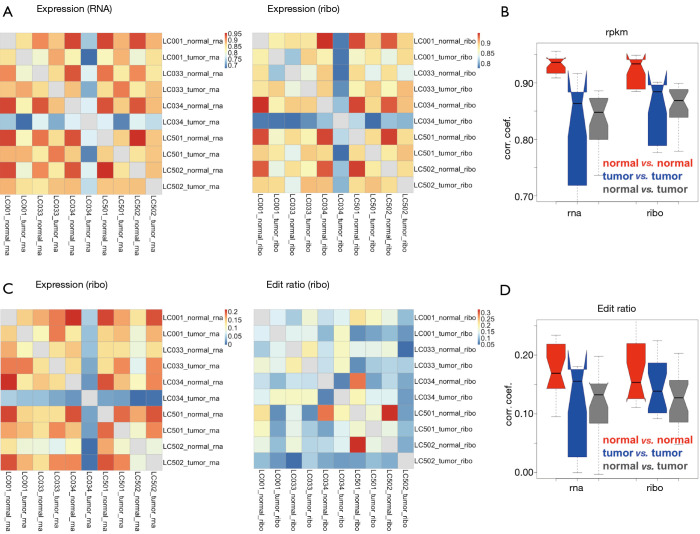
Figure 2.
The pairwise Spearman correlation among each sample. (A) The pairwise Spearman correlation of gene expression (RPKM) among the samples; (B) Boxplots of Spearman correlation coefficients. Normal samples have the highest pairwise correlation while the normal versus tumor samples have the lowest correlation; (C) the pairwise Spearman correlation of editing ratios among the samples; (D) Boxplots of Spearman correlation coefficients. Normal samples have the highest pairwise correlation while the normal versus tumor samples have the lowest correlation.

