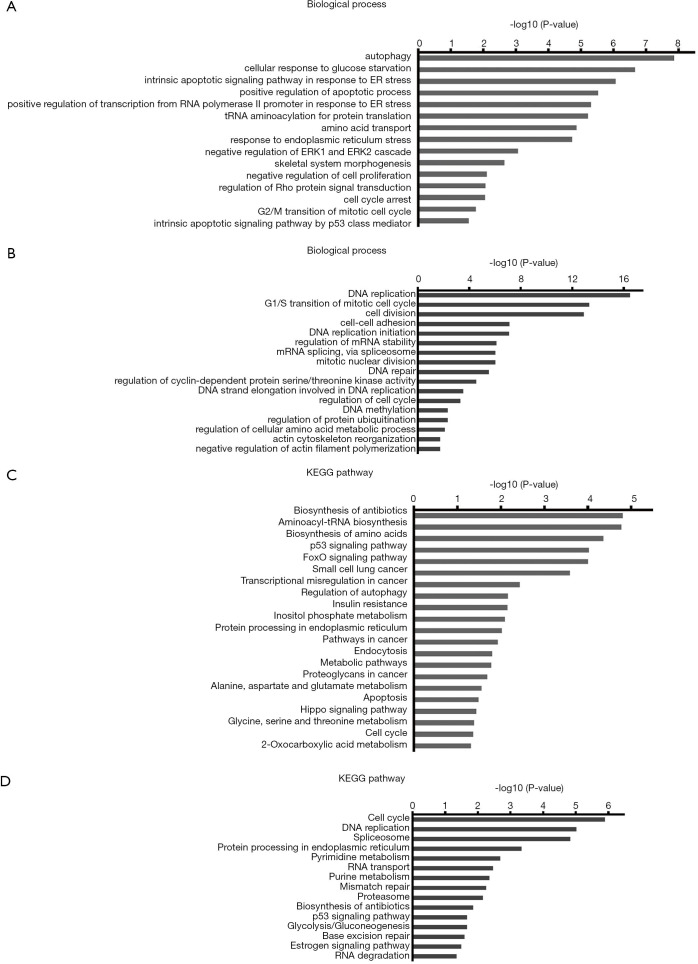
Figure 4.
GO function and KEGG pathway enrichment analysis of DEGs identified in HCC827-ER3 cells treated with combination of erlotinib and MGCD265. (A,C) The top biological process terms of GO analysis and the top KEGG signaling pathways enriched amongst the upregulated genes. (B,D) The top biological process terms and the top KEGG signaling pathways enriched amongst the downregulated genes. The y-axis indicates functional groups by GO category. The x-axis indicates –log (P value) of GO category. Significance is expressed as the P value calculated using Fisher’s exact test (P<0.05). GO, Gene Ontology; KEGG, Kyoto Encyclopedia of Genes and Genomes; DEGs, differentially-expressed genes.

