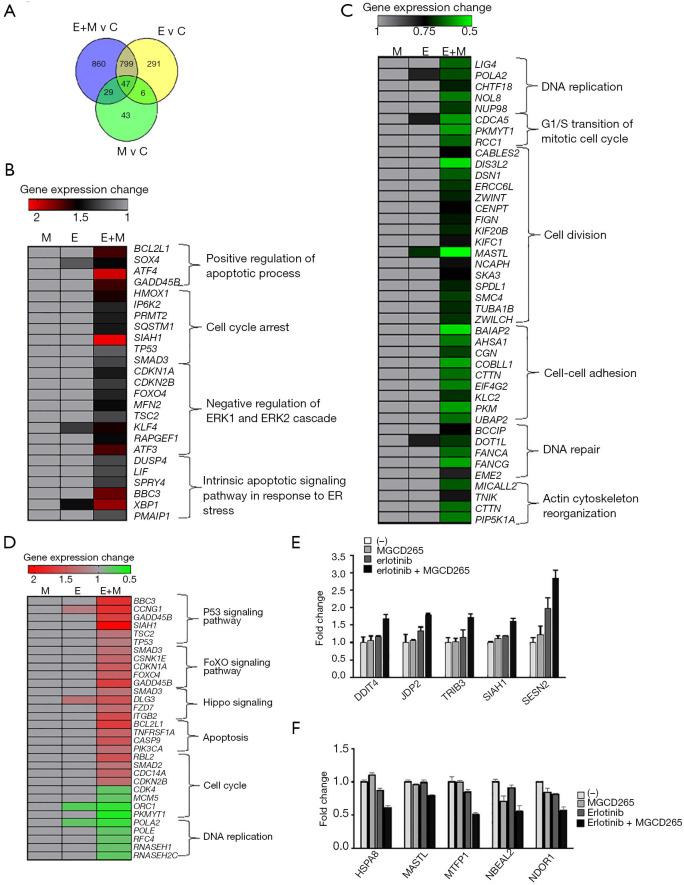
Figure 5.
RNA-seq-based transcriptome comparison between different treatment conditions and validation of DEGs identified in these treatments. (A) Venn diagram showing the total number of DEGs (P<0.05) identified in HCC827-ER3 cells treated with erlotinib, MGCD265, or combination of erlotinib and MGCD265 (E, erlotinib; M, MGCD265; and E + M: erlotinib plus MGCD265). (B,C) The expression levels of representative upregulated DEGs (B) and downregulated DEGs (C) that enriched in multiple biological processes in HCC827-ER3 cells with indicated treatments. (D) The expression levels of representative DEGs that enriched in multiple KEGG pathways in HCC827-ER3 cells with indicated treatment. (E,F) The gene expression for 5 of the most highly upregulated (fold change >2) and 5 downregulated (fold change >2) genes were validated by qPCR. DEGs, differentially-expressed genes.

