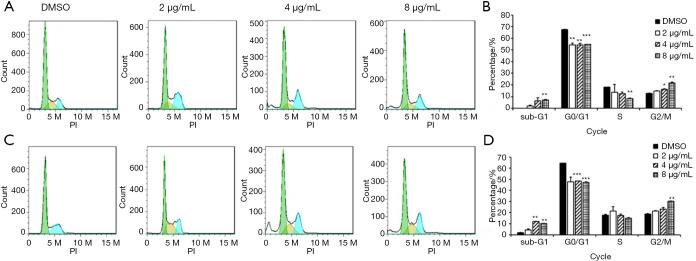
Figure 3.
Cell cycle arrested at G2/M phase in tongue squamous cell carcinoma cells. (A) Cell cycle distribution of SCC9 measured by flow cytometry with PI staining; (B) SCC9 cell cycle arrested at the G2/M phase by bostrycin at doses of 4 and 8 µg/mL within 24 h; (C) cell cycle distribution of SCC25 measured by flow cytometry with PI staining; (D) SCC25 cell cycle arrested at the G2/M phase by bostrycin at dose of 8 µg/mL within 24 h. *P≤0.05, **P≤0.01, ***P≤0.001 vs. DMSO.

