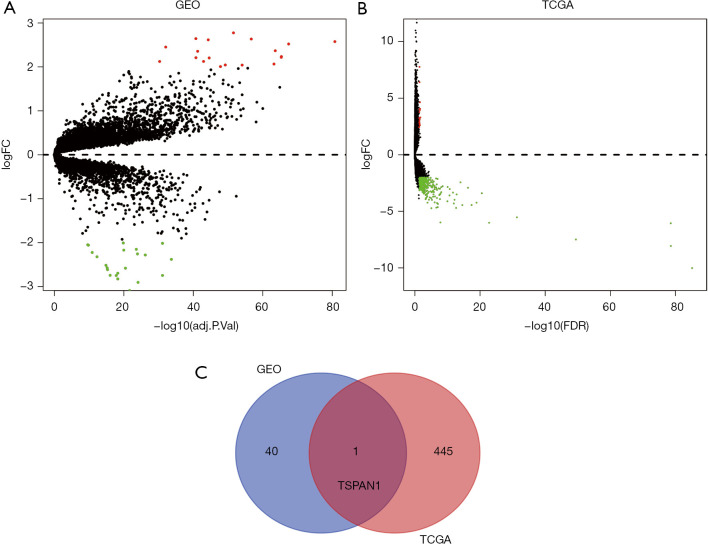
Figure 1.
Identification of DEGs in tumor tissues and adjacent nontumor tissues from PC patients. (A) Volcano plots of DEGs in GEO database. (B) Volcano plots of DEGs in TCGA database. The red dots represent the upregulated genes based on an adjusted P<0.05 and log FC >2; the green dots represent the downregulated genes based on an adjusted P<0.05 and log FC <−2; the black spots represent genes with no significant difference in expression. FC, fold change; GEO, Gene Expression Omnibus. (C) Venn diagrams of common DEGs of GEO and TCGA PC dataset.

