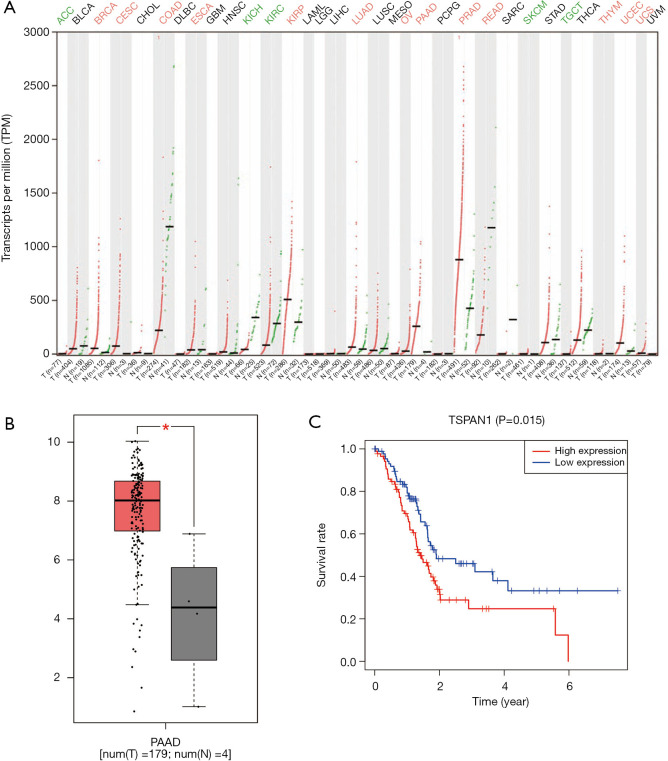
Figure 2.
Expression of TSPAN1 and its effect on OS. (A) The gene expression profile across 33 kinds of tumor samples and paired normal tissues. Each dot represents expression of samples. Red indicates high expression and green indicates low expression. (B) relative expression of TSPAN1 in normal tissues and PC tissues (*, P<0.05). (C) Kaplan-Meier survival curves of TSPAN1 in PC patients

