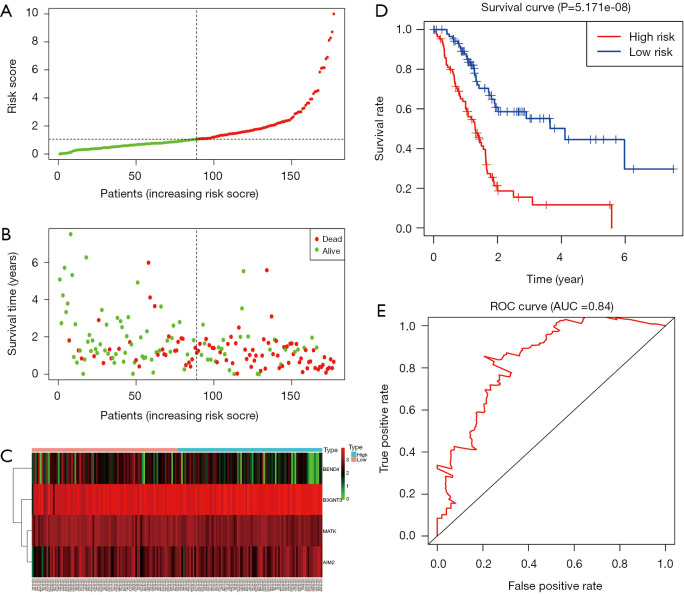
Figure 5.
Prognostic gene signature of the four genes in patients with PC from TCGA dataset. (A) Distribution of risk scores in low-risk and high-risk groups; (B) survival status distribution; (C) the heatmap of the four genes for low- and high-risk group; (D) Kaplan-Meier curves for low-and high-risk groups; (E) receiver operating characteristic curve (ROC) curve of OS in PC patients was predicted according to risk score.

