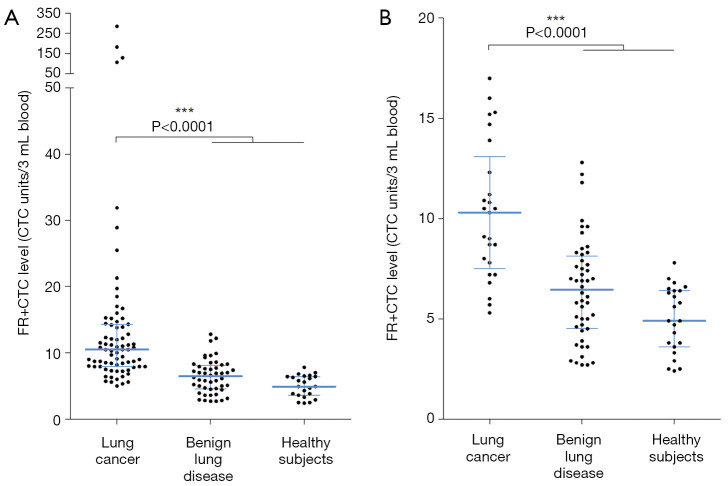
Figure 1.
Expression level of FR+CTC. The dot plot of FR+CTC levels in (A) lung cancer patients, benign lung disease patients, and healthy controls; and (B) stage I lung cancer patients, benign lung disease patients, and healthy controls. Lines indicate the median and inter-quartile range of FR+CTC level. *** indicates P<0.0001. FR+CTC, folate receptor-positive circulating tumor cell.

