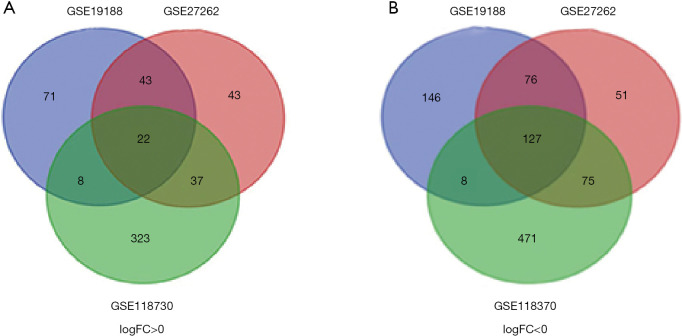
Figure 1.
A total of 149 common differentially expressed genes in 3 datasets (GSE19188, GSE27260 and GSE118370) via Venn diagrams software. Different color meant different datasets. (A) Twenty-two differentially expressed genes were up-regulated in three datasets (logFC >0); (B) 127 differentially expressed genes were down-regulated in three datasets (logFC <0).

