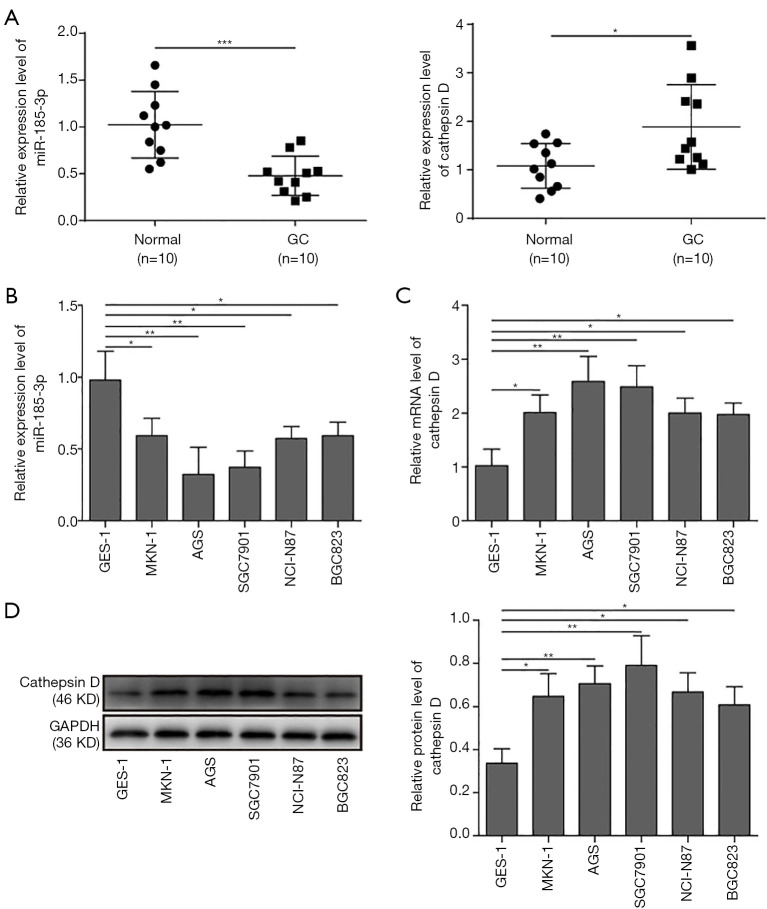
Figure 1.
Expression level of miR-185-3p and cathepsin D in GC cells. (A) qRT-PCR analysis of miR-185-3p and cathepsin D in patient-derived tumor tissues and paired adjacent normal tissues. Expression level of miR-185-3p was decreased, while the expression of cathepsin D was elevated in tumor tissue compared with normal tissue. (B) qRT-PCR analysis of miR-185-3p in various GC cell lines. Expression level of miR-185-3p in GC cells was noticeably lower than that in gastric epithelial cells, where AGS cells showed the lowest level of miR-185-3p among all tested cells. (C) qRT-PCR analysis of cathepsin D in various GC cell lines. Expression level of cathepsin D in GC cells was higher than that in gastric epithelial cells, where AGS and SGC7910 cells showed the two highest level of cathepsin D among all tested cells. (D) Western blotting analysis of cathepsin D in GC cells. The quantification of cathepsin D expression level was normalized against GAPDH. *, P<0.05; **, P<0.01; ***, P<0.001.

