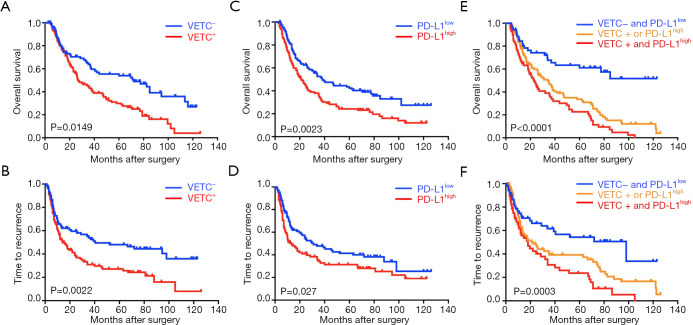
Figure 2.
Clinical implications of VETC and PD-L1 in ICC. (A,B) Kaplan-Meier curves for OS and TTR based on VETC pattern in training cohort (n=214); (C,D) Kaplan-Meier curves for OS and TTR based on PD-L1 expression in training cohort (n=214); (E,F) Kaplan-Meier curves for OS and TTR based on combined VETC pattern and PD-L1 expression in training cohort (n=214). VETC, vessels encapsulate tumor clusters; ICC, intrahepatic cholangiocarcinoma; TTR, time to relapse; OS, overall survival.

