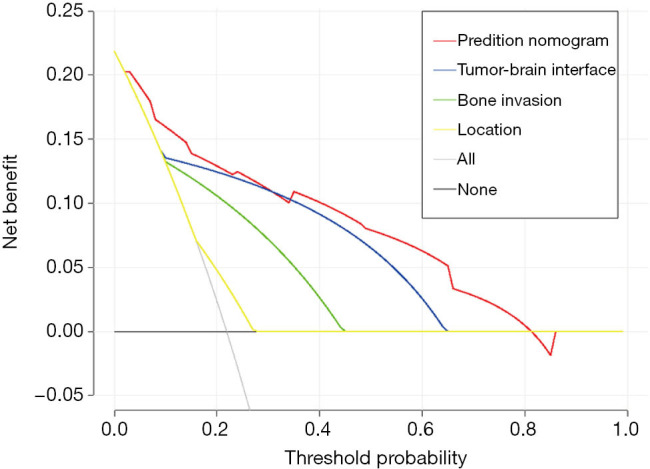
Figure 4.

Decision curve analysis for the diagnostic nomogram. The net benefit was calculated by subtracting the proportion of all false positive patients from the proportion of true positives, and was then weighted based on the associated harms of prior treatment and outcomes that did not require treatment.
