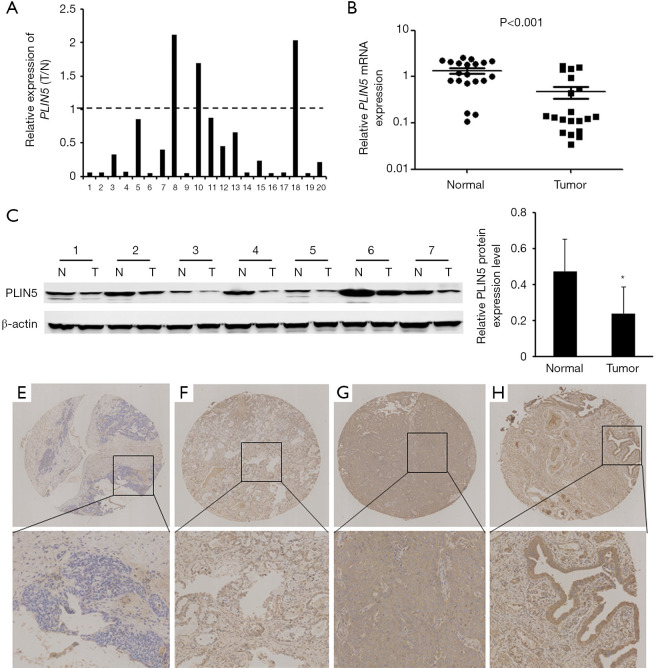
Figure 2.
Expression levels of PLIN5 in ovarian cancer. (A) qPCR analysis indicated that PLIN5 expression was downregulated in 20 OC tissues. (B) The downregulation of PLIN5 was statistically significant compared to normal tissues. (C) Western blot analysis of representative paired samples of OC (T) and their matched adjacent normal tissues (N). (D) Relative average PLIN5 protein expression levels were significantly downregulated in OC tissues compared with the corresponding adjacent normal tissues (*, P<0.05). Representative patterns of PLIN5 expression in ovarian tissues were present by immunohistochemical analysis. (E) OC samples weakly positively stained with a staining index marked as +. (F) OC samples moderately positively stained with a staining index marked as ++. (G) OC samples strongly positively stained with a staining index marked as +++. (H) Normal ovarian samples strongly positively stained with a staining index marked as +++. Original magnification, ×40 or ×200. OC, ovarian cancer.

