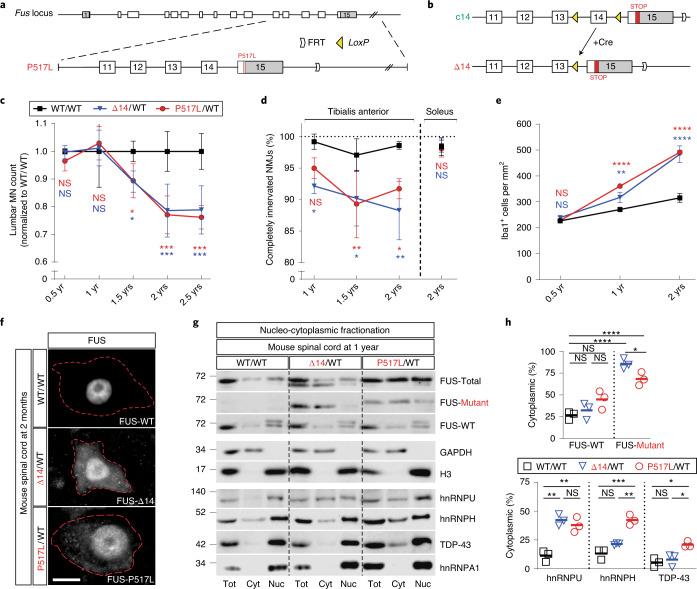
Fig. 1. Selective MN degeneration and mislocalization of FUS and other RBPs to the cytoplasm in knock-in mice expressing ALS-associated mutant FUS.
a, Schematic of the creation of mutant Fus knock-in alleles. Top: the murine Fus locus. Bottom: the P517L targeting vector used for homologous recombination. Exons are represented as gray (5′ UTR and 3′ UTR) and white (coding sequence) rectangles. FRT site downstream of the 3′ UTR is the ‘scar’ left after removal of NEO resistance cassette. b, Conditional c14 allele (top) has exon 14 flanked by LoxP sites (yellow triangles). Cre recombinase-dependent recombination at the LoxP sites in c14 excises exon 14 and converts it to the mutant Δ14 allele. In addition, part of the mouse exon 15 (red rectangle) is ‘humanized’—replaced with the corresponding human exon 15 sequence. This modification does not affect the in-frame protein sequence (c14 allele produces wild-type mouse FUS protein) but alters the Δ14 C-terminal amino acid sequence to mirror the out-of-frame reading of human G466VfsX14 mutant exon 15. c, Numbers of ChAT-positive MNs at lumbar levels 4 and 5 in WT/WT (black), P517L/WT (red) and Δ14/WT (blue) animals normalized to the wild-type controls. n = 3 animals per group at 1 and 2 years and n = 5 animals per group at 1.5 years. d, Percentage of completely innervated NMJs (that is, not partially or completely denervated) in tibialis anterior (left) and soleus (right) muscles of WT/WT (black), P517L/WT (red) and Δ14/WT (blue) animals. n = 3 animals per group at 1 and 2 years and n = 4 animals per group at 1.5 years. e, Density of Iba1-positive microglial cells at lumbar levels 4 and 5 in WT/WT (black), P517L/WT (red) and Δ14/WT (blue) animals. n = 3 animals per group. f, Representative images of MNs from spinal cord sections of 2-month-old WT/WT, Δ14/WT and P517L/WT animals stained with FUS-Abcam[1-50], FUS-Δ14 and FUS-P517L antibodies, respectively. Red dotted lines outline MN somata. Scale bar, 10 µm. g,h, Blot (g) and quantification (h) of nucleo-cytoplasmic fractionation of brain tissue of 1-year-old wild-type (WT/WT) and heterozygous mutant (P517L/WT and Δ14/WT) animals showing mislocalization of mutant FUS and other RBPs to the cytoplasm in the mutant mice. *P < 0.05, **P < 0.01 and ***P < 0.001, using one-way ANOVA with Tukey’s post hoc test. n = 3 for all genotypes. Individual values and means are shown. For c, d and e: *P < 0.05, **P < 0.01 and ***P < 0.001, using two-way ANOVA with Tukey’s post hoc test. Data are shown as mean ± s.d. NS, not significant.

