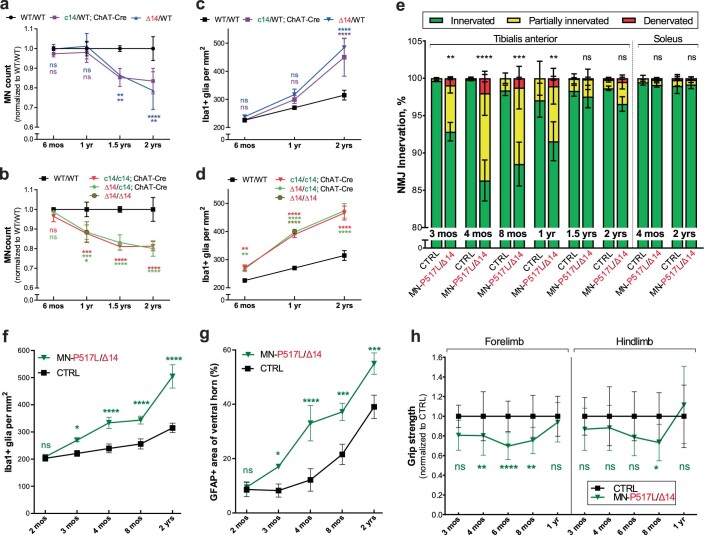
Extended Data Fig. 5. Conditional c14 expression: NMJ denervation, selective motor neuron loss, gliosis and grip strength.
(a) Numbers of ChAT positive motor neurons at lumbar levels 4 and 5 in WT/WT (black) and MN-Δ14/WT (c14/WT; ChAT-Cre and Δ14/WT, purple and blue respectively) animals normalized to the wild type controls. (b) Numbers of ChAT positive motor neurons at lumbar levels 4 and 5 in WT/WT (black) and MN-Δ14/Δ14 (c14/c14; ChAT-Cre, Δ14/c14; ChAT-Cre, and Δ14/Δ14, red, green, and brown respectively) animals normalized to the controls. (c) Density of Iba1-positive microglial cells at lumbar levels 4 and 5 in WT/WT (black) and MN-Δ14/WT (c14/WT; ChAT-Cre and Δ14/WT, purple and blue respectively) animals. (d) Density of Iba1-positive microglial cells at lumbar levels 4 and 5 in WT/WT (black) and MN-Δ14/Δ14 (c14/c14; ChAT-Cre, Δ14/c14; ChAT-Cre, and Δ14/Δ14, red, green, and brown respectively) animals. (e) Percentages of NMJs classified as fully innervated (green), partially denervated (yellow), and fully denervated (red) in the tibialis anterior (left) and soleus (right) muscles in CTRL (FUS WT-expressing control) and MN-P517L/Δ14 (FUS P517L/c14; ChAT-Cre) animals. *P < 0.05, **P < 0.01 and ***P < 0.001 indicates significant differences in fully denervated NMJs using two-way ANOVA with Sidak´s post hoc test. Data shown as mean ± SD. N = 3 animals per group. (f) Density of Iba1-positive microglial cells at lumbar levels 4 and 5 in CTRL (FUS WT-expressing control, black) and MN-P517L/Δ14 (FUS P517L/c14; ChAT-Cre, green) animals. (g) Percentage of cross-sectional area that is GFAP-positive at lumbar levels 4 and 5 in CTRL (FUS WT-expressing control, black) and MN-P517L/Δ14 (FUS P517L/c14; ChAT-Cre, green) animals. (h) Normalized grip strength of forelimbs (left) and hindlimbs (right) in CTRL (FUS WT-expressing control, black) and MN-P517L/Δ14 (P517L/c14; ChAT-Cre, green) animals normalized to the controls. *P < 0.05, **P < 0.01 and ***P < 0.001 using two-way ANOVA with Sidak´s post hoc test. Data shown as mean ± SD. N = 5–28 per group at different time points. For a-d, *P < 0.05, **P < 0.01 and ***P < 0.001 using two-way ANOVA with Tukey´s post hoc test. Data shown as mean ± SD. N = 3 animals per genotype. For f and g, *P < 0.05, **P < 0.01 and ***P < 0.001 using two-way ANOVA with Sidak´s post hoc test. Data shown as mean ± SD. N = 3 animals per group. CTRL=littermate c14/WT and/or c14/c14 animals depending on the breeding scheme.

