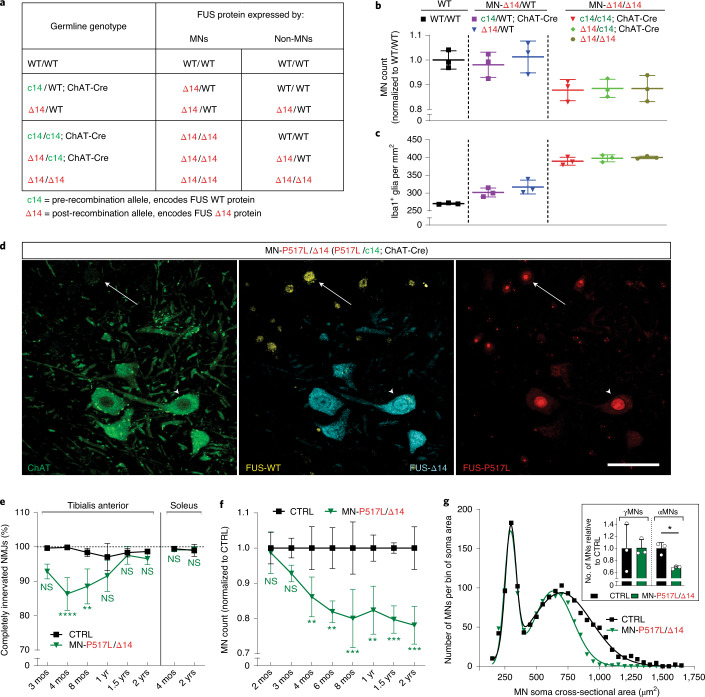
Fig. 3. Increased dosage of mutant FUS in MNs accelerates selective MN degeneration.
a, Table relating the indicated mouse genotypes to WT and Δ14 FUS protein expression in MN and non-MN cells. b, Numbers of ChAT-positive MNs at lumbar levels 4 and 5 in 1-year-old WT/WT (left), MN-Δ14/WT (middle, c14/WT; ChAT-Cre and Δ14/WT) and MN-Δ14/Δ14 (right, c14/c14; ChAT-Cre, Δ14/c14; ChAT-Cre and Δ14/Δ14) animals normalized to the wild-type controls. Each of the MN-Δ14/Δ14 genotypes shows fewer lumbar MNs in comparison to either of MN-Δ14/WT genotypes or WT/WT group, using one-way ANOVA followed by Fisher’s least significant difference. Data are shown as mean ± s.d. n = 3 animals per genotype. c, Density of Iba1-positive microglial cells at lumbar levels 4 and 5 in 1-year-old WT/WT (left, black), MN-Δ14/WT (middle, c14/WT; ChAT-Cre and Δ14/WT) and MN-Δ14/Δ14 (right, c14/c14; ChAT-Cre, Δ14/c14; ChAT-Cre and Δ14/Δ14) animals. Each of the MN-Δ14/WT genotypes show an increase in microglial density in comparison to WT/WT animals. Each of the MN-Δ14/Δ14 genotypes has increased microglial density in comparison to either of MN-Δ14/WT genotypes or WT/WT group. Statistical significance was determined by one-way ANOVA with Tukey’s post hoc test. Data are shown as mean ± s.d. n = 3 animals per genotype. d, Immunostaining of lumbar spinal cord sections of adult MN-P517L/Δ14 (P517L/c14; ChAT-Cre) animals using anti-ChAT (green), anti-FUS-WT (Abcam[1-50], yellow), anti-FUS-Δ14 (cyan) and mouse monoclonal anti-FUS-P517L (red) antibodies. Note anti-FUS-P517L staining in all cells, anti-FUS-Δ14 staining only in ChAT-positive cells and anti-FUS-WT staining only in ChAT-negative cells. Scale bar, 100 µm. e, Percentage of completely innervated NMJs (that is, not partially or completely denervated) in TA (left) and soleus (right) muscles of CTRL (FUS WT-expressing control, black) and MN-P517L/Δ14 (P517L/c14; ChAT-Cre, green) animals. f, MN numbers at lumbar level 4 and 5 of CTRL (FUS WT-expressing control, black) and MN-P517L/Δ14 (P517L/c14; ChAT-Cre, green) animals normalized to the controls. g, Histogram of MN soma cross-sectional areas of CTRL (FUS WT-expressing control, black) and MN-P517L/Δ14 (P517L/c14; ChAT-Cre, green) animals. MNs with soma area ≥475 µm2 were classified as alpha-MNs, and MNs with soma area <475 µm2 were classified as gamma-MNs. Inset shows the numbers of ChAT-positive gamma-MNs (left) or alpha-MNs (right) at lumbar levels 4 and 5 in 2-year-old CTRL (FUS WT-expressing control, black) and MN-P517L/Δ14 (P517L/c14; ChAT-Cre, green) animals normalized to the controls. *P < 0.05, **P < 0.01 and ***P < 0.001, using Welch’s t-test. Data are shown as mean ± s.d. n = 3 animals per group. For e and f, *P < 0.05, **P < 0.01 and ***P < 0.001, using two-way ANOVA with Sidak´s post hoc test. Data are shown as mean ± s.d. n = 3 animals per group. CTRL, littermate c14/WT and/or c14/c14 animals depending on the breeding scheme.

