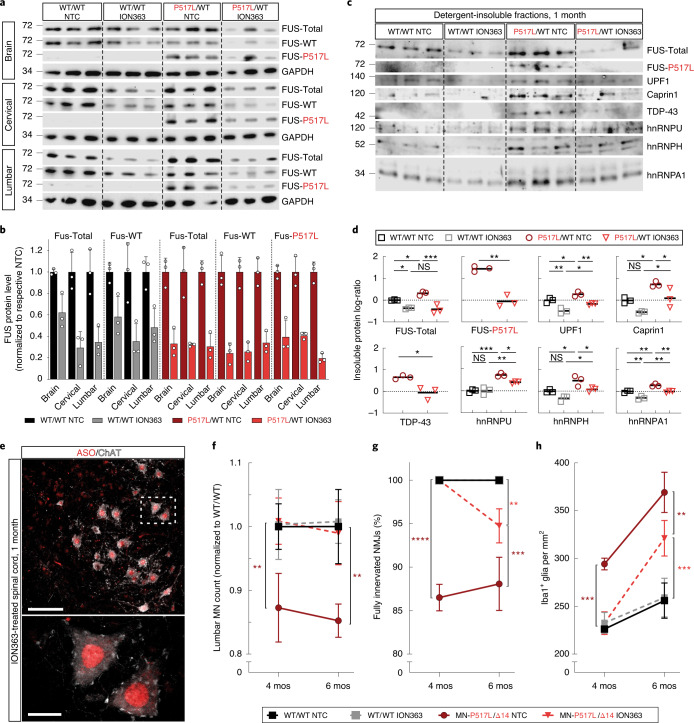
Fig. 4. Efficacy of the FUS ASO ION363 in FUS-ALS knock-in mice.
a, Immunoblot probed with anti-FUS antibodies of brain and cervical or lumbar spinal cord protein lysates of 1-month-old WT/WT and P517L/WT animals treated with NTC or anti-FUS oligonucleotide (ION363). Each band in a row represents a separate animal. b, Quantitation of total, WT and P517L FUS protein levels shown in a. Welch’s t-test was used for comparisons of NTC versus ION363 within each genotype and neuroanatomical region. Data are shown as mean ± s.d. n = 3 animals per group. c, Immunoblot of brain sarkosyl-insoluble fractions of 1-month-old WT/WT and P517L/WT animals treated with NTC or anti-FUS oligonucleotide (ION363). Each lane represents a separate animal. d, Quantitation of protein in sarkosyl-insoluble fractions shown in c, expressed as log-ratio of P517L/WT ION363 for FUS-P517L and TDP-43 and as log-ratio of WT/WT NTC for all others. *P < 0.05, **P < 0.01 and ***P < 0.001, using one-way ANOVA with Tukey´s post hoc test for comparison of four groups and Welch’s t-test for two groups. n = 3 animals per group. Individual values and means are shown. e, Immunostaining of lumbar spinal cord sections of a 1-month-old ION363-treated animal with anti-ASO (red) and anti-ChAT (white) antibodies showing broad distribution of ION363 to MNs and other cells and predominantly nuclear localization. Scale bar, 100 µm at ×20 and 20 µm at ×100. f, Numbers of ChAT-positive MNs at lumbar levels 4 and 5 in NTC-treated FUS WT-expressing CTRL (black), ION363-treated FUS WT-expressing CTRL (gray), NTC-treated MN-P517L/Δ14 (dark red) and ION363-treated MN-P517L/Δ14 (light red) animals normalized to the NTC-treated FUS WT-expressing CTRL. g, Percentage of fully innervated NMJs in the TA muscles in NTC-treated FUS WT-expressing CTRL (black), ION363-treated FUS WT-expressing CTRL (gray), NTC-treated MN-P517L/Δ14 (dark red) and ION363-treated MN-P517L/Δ14 (light red) animals. h, Density of Iba1-positive microglial cells at lumbar levels 4 and 5 in NTC-treated FUS WT-expressing CTRL (black), ION363-treated FUS WT-expressing CTRL (gray), NTC-treated MN-P517L/Δ14 (dark red) and ION363-treated MN-P517L/Δ14 (light red) animals. For f–h, *P < 0.05, **P < 0.01 and ***P < 0.001, using two-way ANOVA with Tukey’s post hoc test. Data are shown as mean ± s.d. n = 3 animals per group.

