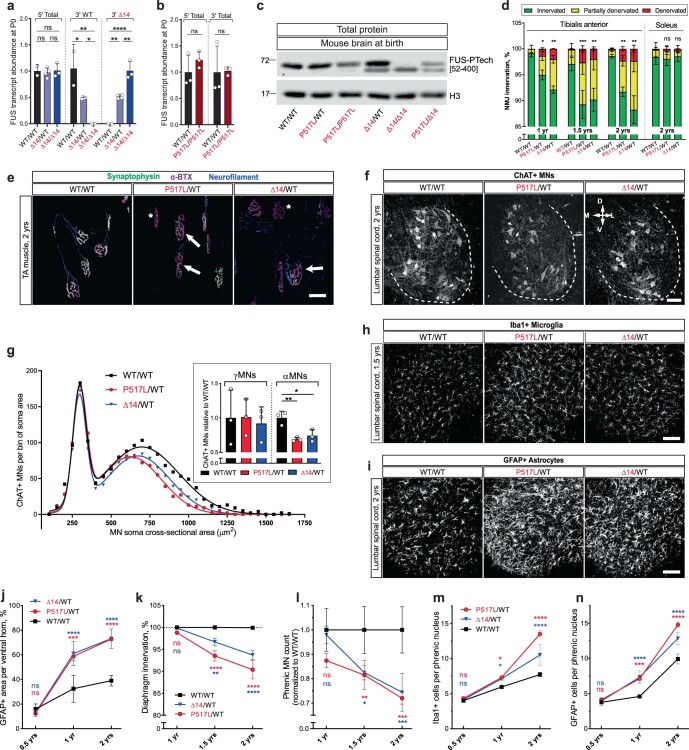
Extended Data Fig. 1. ALS-like pathology in mutant FUS knock-in mice.
(a) RT-qPCR quantification of newborn (P0) brain Fus transcripts in wild type (WT/WT), Fus Δ14 heterozygous (Δ14/WT) and Fus Δ14 homozygous (Δ14/Δ14) animals using primers positioned in exons 1–3 of the Fus transcript that amplify WT and Δ14 equally (5’ Total), primers spanning exon 13–14 junction specific to the WT Fus transcript (3’ WT), or primers spanning exon 13–15 junction specific to the Δ14 Fus transcript (3’ Δ14). Transcript abundances were normalized to WT/WT for ‘5’ Total’ and ‘3’ WT” and to Δ14/ Δ14 for ‘3’ Δ14’. N = 2, 4, and 3 for WT/WT, Δ14/WT, and Δ14/ Δ14 respectively. *P < 0.05, **P < 0.01 and ***P < 0.001, using one-way ANOVA with Tukey’s post hoc test. Data shown as mean ± SD. (b) RT-qPCR quantification of newborn (P0) brain Fus transcripts in wild type (WT/WT) and Fus 517L homozygous (P517L/P517L) animals using primers positioned in exons 1–3 (5’ Total) or in exons 13–14 (3’ Total) of the Fus transcript that amplify WT and 517L equally. Transcript abundances were normalized to WT/WT. N = 3 animals of each genotype for each group. Statistical significance was assessed using Welch’s t-test. Data shown as mean ± SD. (c) Representative immunoblot of brain total protein extracts from newborn animals using FUS-PTech[52–400] antibody. (d) Percentages of NMJs classified as fully innervated (green), partially denervated (yellow), and fully denervated (red) in the tibialis anterior (left) and soleus (right) muscles in WT/WT, P517L/WT, and Δ14/WT animals. *P < 0.05, **P < 0.01 and ***P < 0.001 indicates significant differences in fully denervated NMJs between the corresponding genotype and WT controls using two-way ANOVA with Dunnett’s post hoc test. Data shown as mean ± SD. N = 3 animals per group at 1 and 2 years and 4 animals per group at 1.5 years. (e) Representative images of tibialis anterior (TA) muscle innervation in 2-year-old WT/WT (left), P517L/WT (middle), and Δ14/WT (right) animals. Muscle innervation was determined by co-localization of markers for motor axon terminals (anti-synaptophysin antibody, green) and post-synaptic NMJ acetylcholine receptors (fluorophore-conjugated α-bungarotoxin, or α-BTX, magenta). In addition, motor axons were labeled with anti-neurofilament antibody (blue). White asterisks indicate fully denervated motor endplates (prominent α-BTX with no overlapping synaptophysin, absent neurofilament) and white arrows indicate partially denervated NMJs (partial overlap of synaptophysin and α-BTX, presence of neurofilament). Scale bar=50 µm. (f) Representative images of lumbar level 5 (L5) spinal cord ventral horns of 2-year-old WT/WT (left), P517L/WT (middle), and Δ14/WT (right) animals stained with anti-ChAT antibody (white). Compass mark indicates dorsal (D), ventral (V), medial (M) or lateral (L) orientation. Scale bar=100 µm. (g) Histogram of MN soma cross-sectional areas of WT/WT (black), P517L/WT (red), and Δ14/WT (blue) animals. MNs with soma area ≥475 µm2 were classified as α and < 475 µm2 as γMNs. Inset shows the numbers of ChAT-positive γMNs (left) or αMNs (right) at lumbar levels 4 and 5 in 2-year-old WT/WT (black), P517L/WT (red), and Δ14/WT (blue) animals normalized to the wild type controls. *P < 0.05, **P < 0.01 and ***P < 0.001 using one-way ANOVA with Tukey’s post hoc test. Data shown as mean ± SD. N = 3 animals per group. (h) Representative images of lumbar level 5 (L5) spinal cord ventral horns of 1.5-year-old WT/WT (left), P517L/WT (middle), and Δ14/WT (right) animals stained with anti-Iba1 antibody (white). Scale bar=100 µm. (i) Representative images of lumbar level 5 (L5) spinal cord ventral horns of 2-year-old WT/WT (left), P517L/WT (middle), and Δ14/WT (right) animals stained with anti-GFAP antibody (white). Scale bar=100 µm. (j) Percentage of cross-sectional area that is GFAP-positive at lumbar levels 4 and 5 in WT/WT (black), P517L/WT (red), and Δ14/WT (blue) animals. (k) Percentage of completely innervated NMJs (that is, not partially or completely denervated) in the diaphragm muscles WT/WT (black), P517L/WT (red), and Δ14/WT (blue) animals. (l) Numbers of ChAT positive motor neurons in phrenic nucleus at cervical levels 3 through 5 in WT/WT (black), P517L/WT (red), and Δ14/WT (blue) animals normalized to the wild type controls. (m) Numbers of Iba1-positive microglial cells within phrenic nucleus at cervical levels 3 through 5 in WT/WT (black), P517L/WT (red), and Δ14/WT (blue) animals. (n) Numbers of GFAP-positive astroglial cells within phrenic nucleus at cervical levels 3 through 5 in WT/WT (black), P517L/WT (red), and Δ14/WT (blue) animals. For j-n: *P < 0.05, **P < 0.01 and ***P < 0.001, using two-way ANOVA with Tukey’s post hoc test. Data shown as mean ± SD. N = 3 animals of each genotype for each group.

