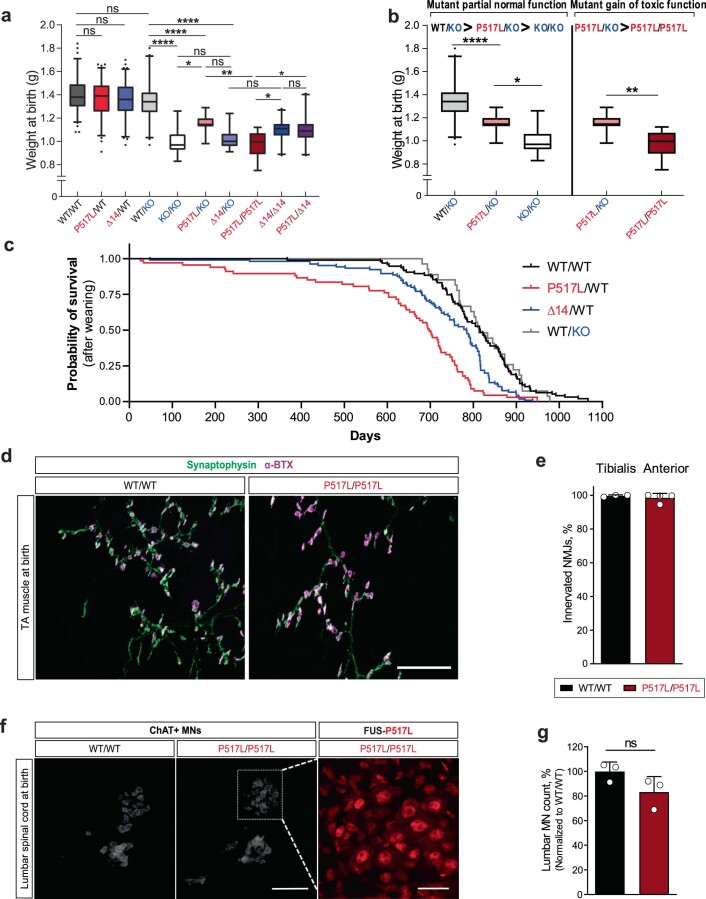
Extended Data Fig. 3. Decreased lifespan of mutant FUS heterozygous animals and absence of NMJ denervation and MN loss in newborn P517L/P517L mice.
(a) Box (median, 25th and 75th percentiles) and whiskers (2.5th and 97.5th percentiles) plot of birth weights of mice with the indicated combinations of Fus WT, P517L, Δ14, and null-knockout (KO) alleles. *P < 0.05, **P < 0.01 and ***P < 0.001, using one-way ANOVA with Tukey’s post hoc test. N = 13–183 animals per genotype as indicated in Table 1. (b) Selected data reproduced from (a) to illustrate partial functionality and dose-dependent toxicity of mutant FUS. Increased birth weight of P517L/KO compared to KO/KO animals demonstrates that mutant FUS protein is able to partially rescue the null phenotype and thus is functional. Comparison of P517L/P517L versus P517L/KO animals demonstrates that further addition of mutant FUS protein decreases birth weight, consistent with dose-dependent toxicity of mutant FUS protein. Statistical significance was assessed in (a) as a part of a full analysis of all genotype groups. (c) Kaplan-Meier survival curves for successfully weaned WT/WT, P517L/WT, Δ14/WT, and WT/KO mice. Both heterozygous mutants but not WT/KO have significantly decreased median survival age compared to wild type controls. All possible pairwise comparisons were performed using Log-rank (Mantel-Cox) test and the resulting p-values were adjusted for multiple comparison using the Bonferroni correction. (d) NMJ staining of tibialis anterior (TA) muscle of newborn WT/WT (left) and homozygous P517L/P517L(right) animals using antibodies to pre-synaptic synaptophysin (green) and alpha-bungarotoxin (magenta, post-synaptic). Scale bar= 100 µm. (e) Quantification of innervated NMJs in the WT/WT (black) and homozygous P517L (dark red) animals. N = 3 for WT/WT and 4 for P517L/P517L groups respectively. (f) Immunofluorescence staining of lumbar level 4–5 (L4-L5) MNs in WT/WT (left) and homozygous P517L/ P517L (right) animals using anti-ChAT and anti-P517L antibodies (right inset panel). Scale bar=25 µm for the left and middle panels, 100 µm for the right panel. (g) Quantification of ChAT-positive neurons in lumbar levels 4–5 (L4-L5) in newborn WT/WT (black) and homozygous P517L/ P517L (dark red) animals. N = 3 animals per genotype. For e and g, statistical significance was assessed using Welch’s t-test. Error bars represent SD.

