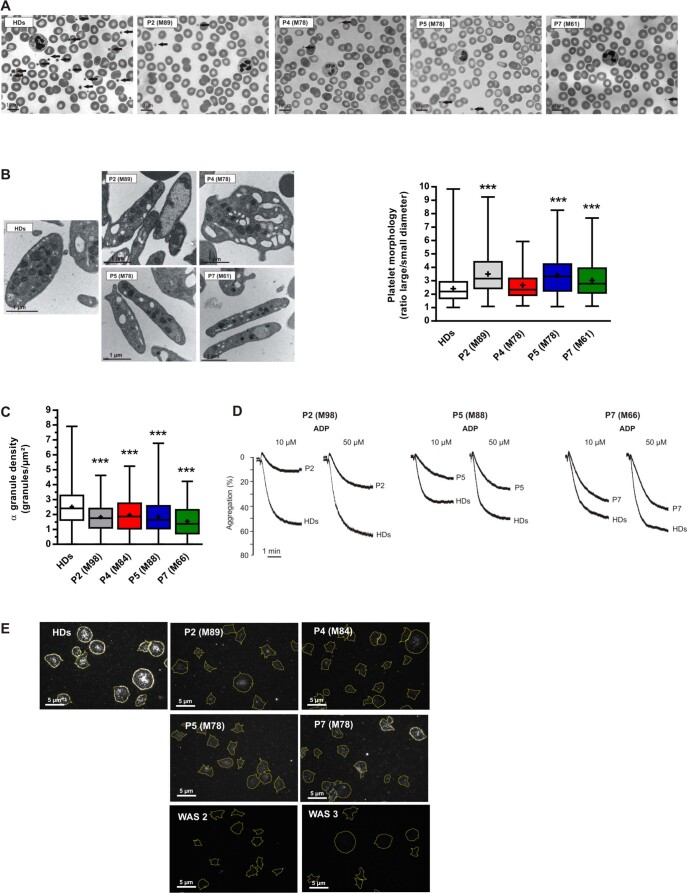
Extended Data Fig. 6. Platelet analyses.
Panel A, Images show blood smears performed once for each GT-treated patients (P) or healthy donors (HDs) after May-Grünwald Giemsa staining. Arrows indicate the platelets. Panel B, TEM analysis of platelet ultrastructure in each patient (P). The box-and-whisker plots show the platelet shape defined as the ratio between the largest diameter and the smallest diameter derived from the TEM images performed once for each patient. Whiskers represent the upper and lower extreme values, the box correspond to the interquartile range, the center line is the median and the cross indicates the mean of 100 platelets for patients and 826 platelets for HDs. Statistical significance was determined in a one-way ANOVA with the Sidak post-test for multiple comparisons. The exact p value was p < 0.0001 for P2, P5, P7 and p = 0.1484 for P4. Panel C, the α-granule density for each patient was quantified by TEM and the results were shown in box-and-whisker plots. Whiskers represent the upper and lower extreme values, the box correspond to the interquartile range, the center line is the median and the cross indicates the mean of 100 platelets for patients and 970 for HDs. Statistical significance was determined in a one-way ANOVA with the Sidak post-test for multiple comparisons. The exact p value was p < 0.0001 for all P2, P5, P7 and p = 0.0002 for P4. Panel D, Aggregation of washed platelets induced by ADP (10 or 50 µM) was evaluated once for P2, P5 and P7. Panel E, WASp expression was evaluated by immunofluorescence in platelets spread onto a fibrinogen matrix after activation with 20 µM ADP. WASp was detected using a specific antibody. The outlines of spread platelets (represented by the yellow lines) were identified by detecting F-actin with fluorescently labeled phalloidin.

