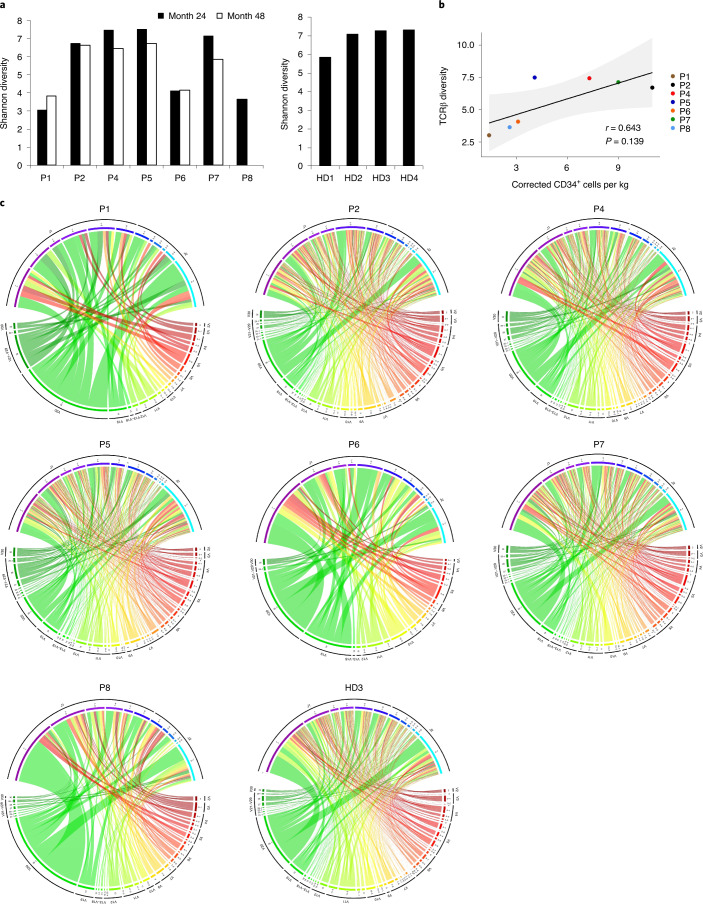
Fig. 2. TCRβ repertoire analysis.
a, Shannon diversity of the TCRβ clonotypes analyzed in patients with WAS (P1, P2, P4–P8) at months 24 and 48 of post-gene therapy follow-up (left) and in four healthy donors (HD1–HD4) (right). b, The Spearman correlation between the TCRβ Shannon diversity at month 24 and the number of corrected CD34+ cells infused per kilogram, for each patient. The P value was calculated using the two-sided Spearman’s rank correlation test, and r is Spearman’s rank correlation coefficient. A regression line is represented in black and the 95% confidence interval is shown in gray. c, Circos plots showing V-gene and J-gene combinations in the repertoires analyzed in patients with WAS at month 48 of post-gene therapy follow-up (except for P8, shown at month 24) and in one healthy donor (HD3). The colored arcs define distinct Vβ and Jβ genes. The ribbon thickness is proportional to the frequency of a given combination.

