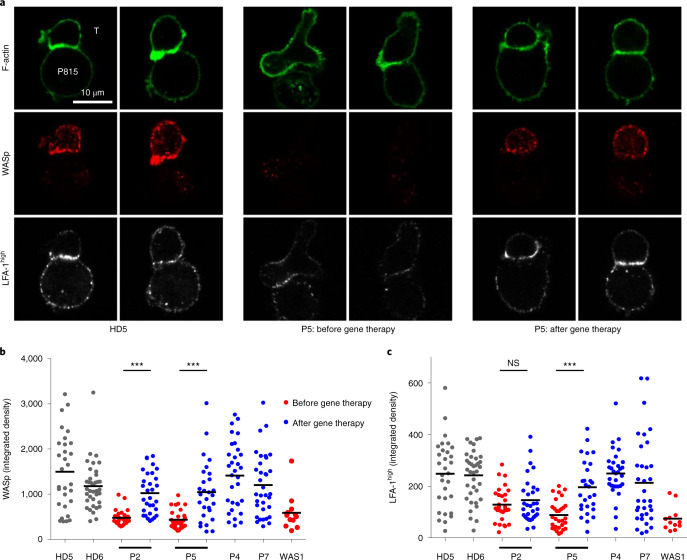
Fig. 3. Restoration of T cell immune synapse assembly after gene therapy.
a, Representative confocal microscopy images of conjugates between the indicated T cells (T, upper cells) and monoclonal anti-CD3 antibody-coated P815 cells (P815, lower cells), after staining for F-actin, WASp and high-affinity LFA-1. The T cells from P5 were collected 55 months after gene therapy; comparable data were collected from additional patients before and after gene therapy (P2) or after gene therapy (P4 and P7). The data were reproduced in two independent experiments (including cell preparation, staining and image acquisition). b, Integrated fluorescence density for WASp in T cells forming conjugates with monoclonal anti-CD3 antibody-coated P815 cells in patients with WAS before and after gene therapy (43, 55, 48 and 41 months afterwards for P2, P5, P4 and P7, respectively), in HDs (HD5 and HD6), and in one non-treated patient with WAS (WAS 1). c, Integrated fluorescence density for high-affinity LFA-1 in the same cells as in b. Overall, 28–37 conjugates per sample were analyzed. Similar results were obtained in another independent experiment. Statistical significance was assessed by unpaired t-test (two-tailed) (***P < 0.0001); NS, not significant (P = 0.3866). Black horizontal lines in b and c represent the mean.

