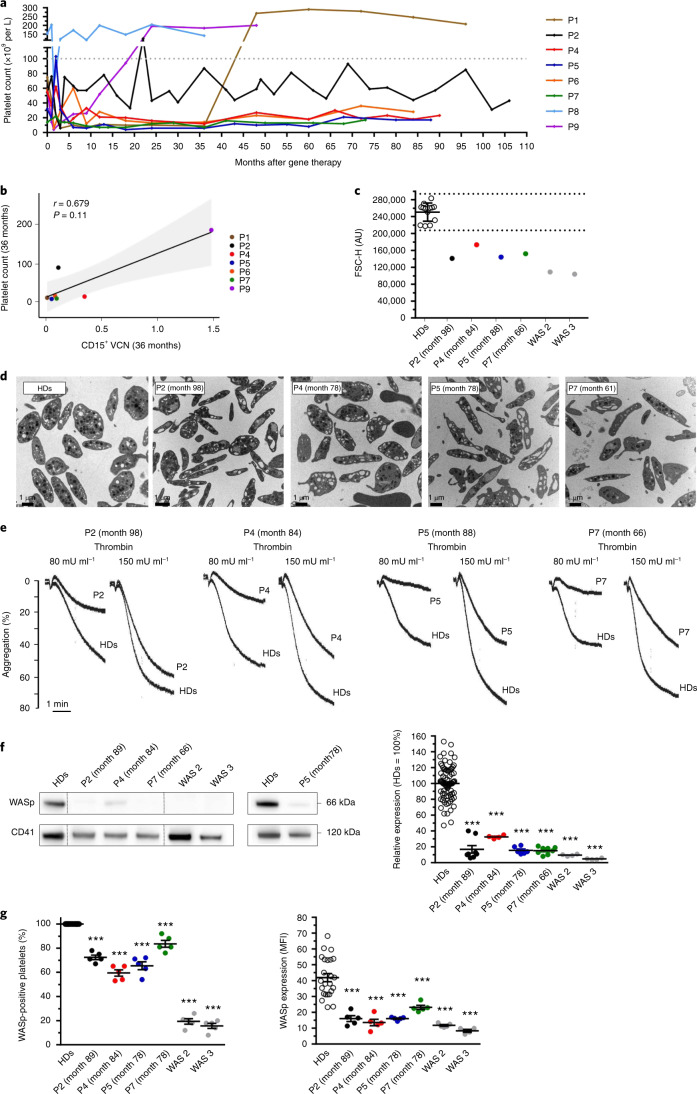
Fig. 5. Hemostasis and platelet profile after gene therapy.
a, Change over time in the platelet count for each patient after gene therapy. b, The Spearman correlation between platelet count and the level of gene marking (VCN) in CD15+ neutrophils after 3 years of follow-up for each patient (apart from P8, for whom the platelet count was corrected following splenectomy before gene therapy). The P value was calculated using the two-sided Spearman’s rank correlation test, and r is Spearman’s rank correlation coefficient. A regression line is represented in black and the 95% confidence interval is shown in gray. c, Platelet size, evaluated using flow cytometry. Each dot represents the mean size of washed platelets from healthy donors (HDs; n = 13), gene therapy-treated patients (P) and non-treated patients with WAS (WAS 2 and WAS 3). The results are expressed as the mean forward scatter height (FSC-H) ± s.d. and the dotted lines indicate the normal range (mean ± 2 s.d.). AU, arbitrary units. d, Platelet ultrastructure, which was analyzed once for each patient using transmission electron microscopy. e, The thrombin-induced aggregation of washed platelets was evaluated once for each patient (P) and healthy controls (HDs). f, WASp expression in patients was evaluated by western blotting. Dotted lines indicate that the samples were derived from the same gel but are non-contiguous. The graph shows the mean of WASp expression ± s.e.m. after normalization against CD41 expression from several independent experiments (HDs, n = 82; P4, WAS 2, WAS 3, n = 4; P5, n = 6; and P2, P7, n = 8). g, WASp expression was evaluated by immunofluorescence in platelets spread onto a fibrinogen matrix after activation with 20 µM ADP. The dot plot on the left shows the mean of the percentage ± s.e.m. of platelets expressing WASp, and the dot plot on the right shows the mean of the WASp expression (determined from the MFI per platelet) ± s.e.m. for five fields of view, which represent a total number of analyzed platelets of 816 for HDs, 170 for P2, 196 for P4, 175 for P5, 145 for P7, 158 for WAS 2 and 168 for WAS 3. In f and g statistical significance was determined using one-way analysis of variance with Dunnett’s post test for multiple comparisons. In f (right) and g (left), the exact P value was P < 0.0001 for all of the patients, and in g (right) the exact P value was P < 0.0001 for P2, P4, P5, WAS 2, WAS 3 and P = 0.0007 for P7. In c–g, all HDs were different donors, except in g (left and right) where HDs were the same.

