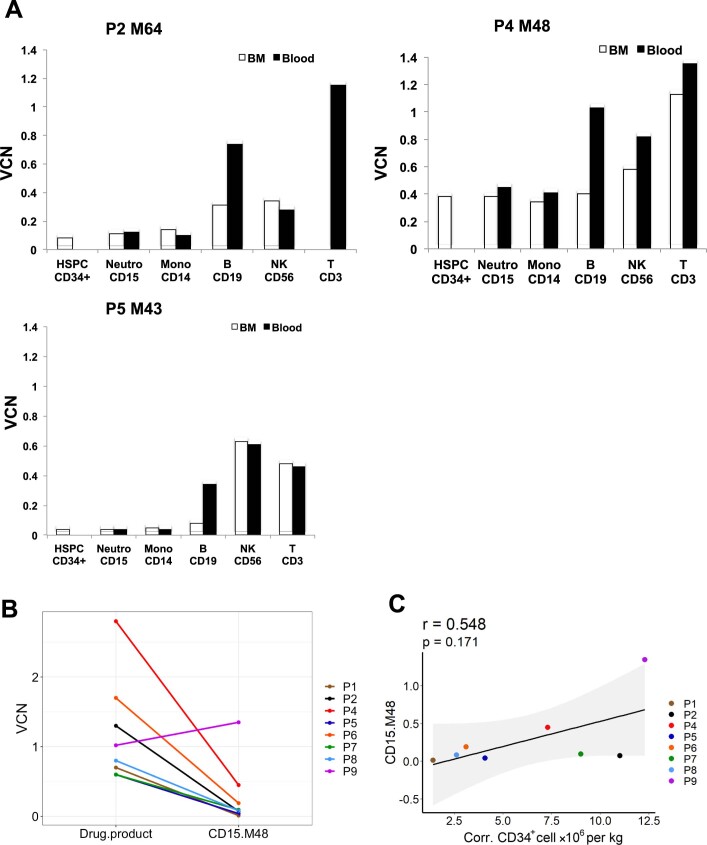
Extended Data Fig. 2. Gene marking level.
Panel A, the VCN in the bone marrow (BM, white) subpopulations versus the peripheral blood (black) subpopulations in patients P2, P4 and P5; Panel B, VCN levels in the initial CD34 + drug product versus myeloid CD15 + cells 48 months after GT. Panel C, The Spearman correlation between the level of gene marking in CD15 + 48 months after GT and the number of corrected CD34 + cells infused per kilogram, for each patient. The pvalue (p) was calculated by using two-sided Spearman’s rank correlation test, r is Spearman’s rank correlation coefficient. A regression line is represented in black, the confidence interval in grey.

