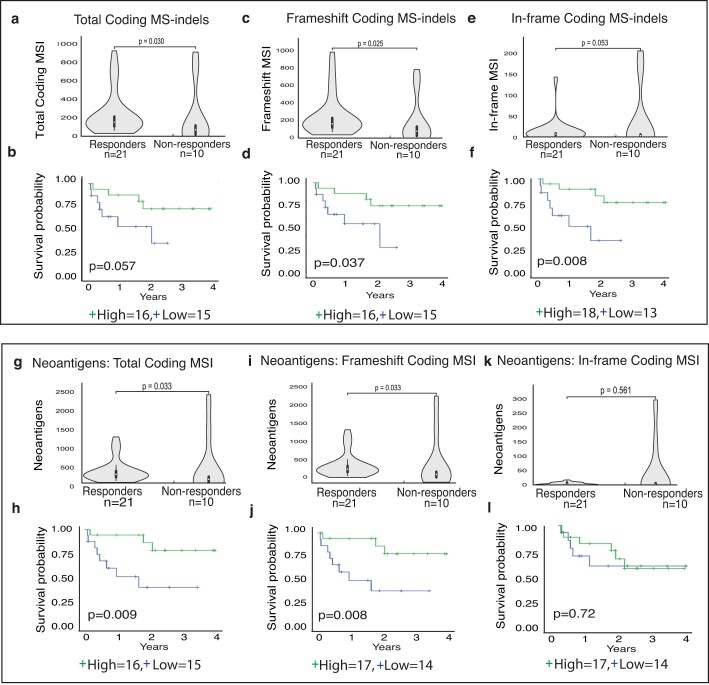
Extended Data Fig. 3. Genomic biomarkers (MS-Indels), survival and response to PD-1 blockade.
(a-f) Total, frameshift and in-frame MS-Indels and outcome. (g-l) Neoantigens generated by total, frameshift and in-frame MS-Indels and outcome. For survival, median values were utilized to stratify into ‘high’ and ‘low’ groups. For all box-plots for responders and non-responders, data are represented as median +/- interquartile range. For statistical significance in comparing responders and non-responders, the Wilcoxon-Mann-Whitney test was used. Survival analysis was performed using the Kaplan-Meier method, and the log-rank test was used to compare groups. All p values are 2-sided.

