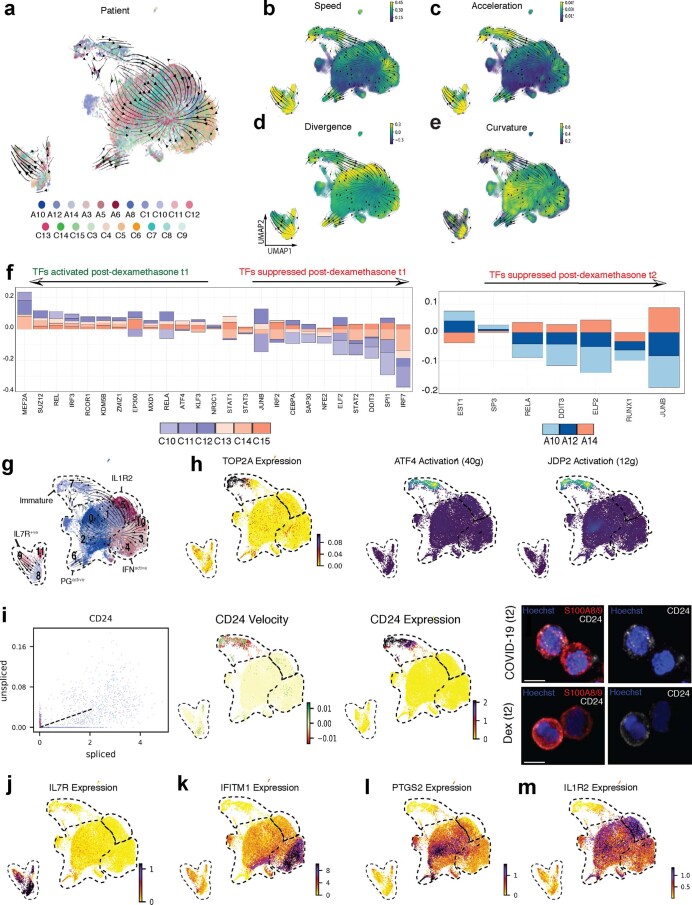
Extended Data Fig. 6. Distinct neutrophil states and their response to dexamethasone.
a. UMAP projection of subclustered neutrophils from 21 patient samples, coloured by individual patient ID. b-e. Cell speed (length of velocity vectors; b), acceleration (subspaces where velocity undergoes dramatic changes in either in magnitude or direction; c), divergence (outward flux indicating the extent to which a point behaves like a source; d) and curvature (hotspots of abrupt vector field change; e). f. Differentially activated consensus TFs upregulated (positive logFC) or suppressed (negative logFC) post-dexamethasone in at least 3 of 6 patients at t1, and in at least 2 of 3 patients at t2. g-j. Neutrophil states (g) can be distinguished by expression of proliferative marker TOP2A and activation of immaturity-associated TFs ATF4 and JDP2 (h), CD24 splicing kinetics, velocity, expression and immunocytochemistry (representative images are shown; n = 3 for each group; Scale bar, 5 μm) (i), IL-7R (j), Interferon-stimulated genes such as IFITM1 (k), genes involved in prostaglandin synthesis such as PTGS2 (l), and IL-1R2 (m).

