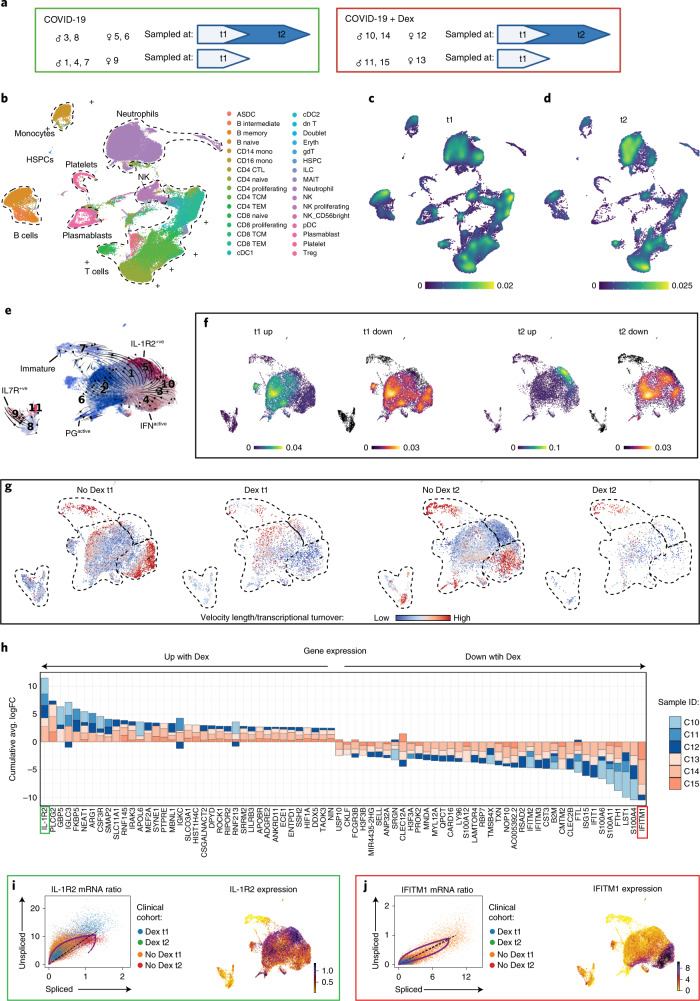
Fig. 3. Dexamethasone suppresses IFN programs and depletes IFNactive neutrophils in COVID-19.
a, Schematic summarizing patients with COVID-19 who were treated with or without dexamethasone profiled at t1 and t2. Comparisons presented included eight non-dexamethasone-treated COVID-19 ARDS (n = 8 at t1 and n = 4 at t2) and six dexamethasone-treated COVID-19 ARDS (n = 6 at t1 and n = 3 at t2) patients who were admitted to the ICU. b, UMAP projection of 80,994 whole blood cells from 21 patient samples, colored by Azimuth reference-mapped immune cell states. c, d, Kernel density estimates depicting magnitude of molecular response elicited by immune cell subsets after dexamethasone treatment at t1 (c) and t2 (d), calculated by summing DEG FCs for each cell state shown in a. e, Neutrophil states overlaid on a UMAP of 23,193 subclustered neutrophils from dexamethasone- and non-dexamethasone-treated patients with COVID-19, colored by cluster ID. f, Magnitude of molecular response elicited by each neutrophil state after dexamethasone treatment calculated by summing DEG FCs for each cell state shown in d, g, RNA velocity vector length (indicating rate of differentiation/state transition) in dexamethasone- and non-dexamethasone-treated neutrophils at t1 and t2. h, Consensus neutrophil DEGs upregulated (positive FC) or suppressed (negative FC) after dexamethasone in at least three of six patients with COVID-19 at t1 relative to non-dexamethasone COVID-19 controls. Stacked bars depict logFC contribution of each dexamethasone-treated patient. i, j, Differential splicing kinetics drives activation of IL-1R2 (i) and suppression of IFITM1 expression (j) after dexamethasone treatment. Phase portraits show equilibrium slopes of spliced–unspliced mRNA ratios. Green denotes most upregulated and red denotes most downregulated DEGs with COVID-19 (f). HSPC, hematopoietic stem and progenitor cell. Dex, dexamethasone.

