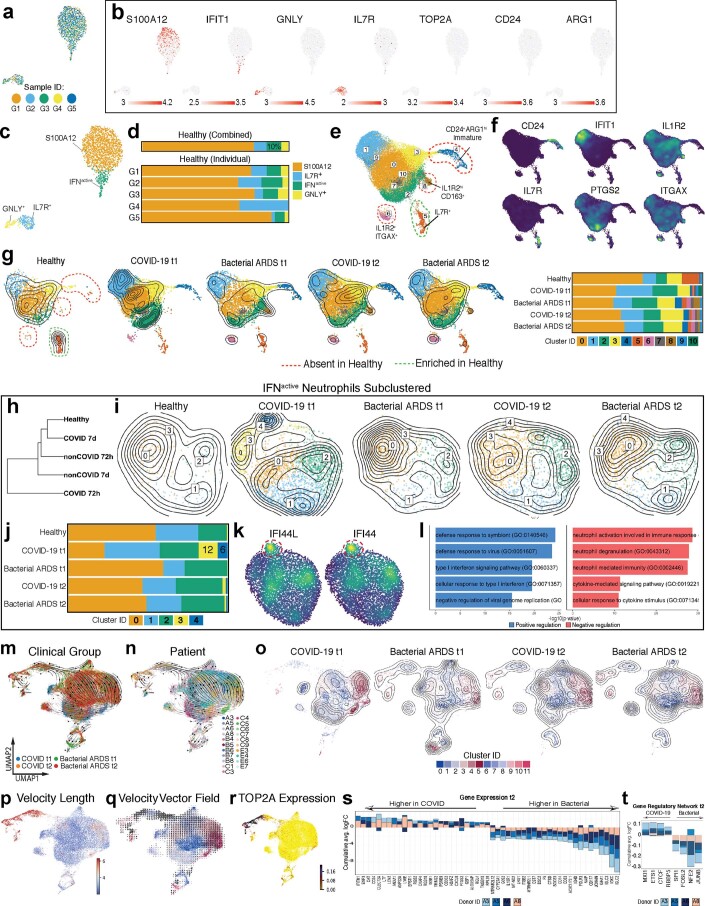
Extended Data Fig. 4. COVID-19 infection reprograms neutrophil maturation by driving expansion of ISG- and PG-expressing subsets.
a. UMAP of neutrophils from healthy donors (n = 1,912 cells) colored by donor of origin. b. Neutrophil state-defining markers. c. UMAP of neutrophils from healthy donors colored by neutrophil states. d. Neutrophil state composition in healthy donors, combined across all donors or separated by individual donor ID. e. Subclustered neutrophils, integrated across patient cohorts to compare healthy, bacterial ARDS at t1 and t2, and COVID-19 ARDS at t1 and t2. f. Kernel density plots showing expression of neutrophil state-defining markers. g. Cohort-separated UMAPs, colored by subcluster ID and overlaid with cell density contour plots, and bar plot depicting neutrophil cluster composition across cohorts. h. Dendrogram showing unsupervised hierarchical clustering of IFNactive neutrophils by showing relatedness of this subset across patient cohorts. i-j. Cohort-separated UMAPs of IFNactive neutrophils, colored by subcluster ID and overlaid with cell density contour plots (i), and bar plot showing cluster composition (j) across cohorts. k-l. Expression of genes (k) and signalling pathways (l) enriched in COVID-19 t1 IFNactive neutrophil relative to remaining cohorts. m-n. UMAP plotting velocity analysis of 29,653 subclustered neutrophils undergoing state transitions, coloured by clinical cohort (m) and donor IDs (n). o. Cohort-separated UMAPs, colored by neutrophil subcluster ID and overlaid with cell density contour plots. p-q. Subclustered neutrophil UMAPs, coloured by magnitude of velocity vector length reflecting the difference between expected versus recovered unspliced counts (p) and neutrophil Louvain clusters overlaid with velocity vector fields (q). r. Expression of immature neutrophil marker TOP2A. s-t. Consensus plot of differentially expressed genes (s) and SCENIC-inferred transcription factors (t) upregulated (positive logFC) or suppressed (negative logFC) in neutrophils from at least 2 of 4 patients with COVID-19 relative to bacterial ARDS at t2.

